$RWAUSDT 1D ChartLSE:RWA 1D chart shows a bullish bounce from the long-term descending trendline.
The price is now targeting the key resistance zone between $0.018175 and $0.021445.
A breakout above this range could trigger a strong rally of over +300%. Momentum looks promising.
Watch this level closely for confirmation.
DYRO, NFA
RWAUSDT trade ideas

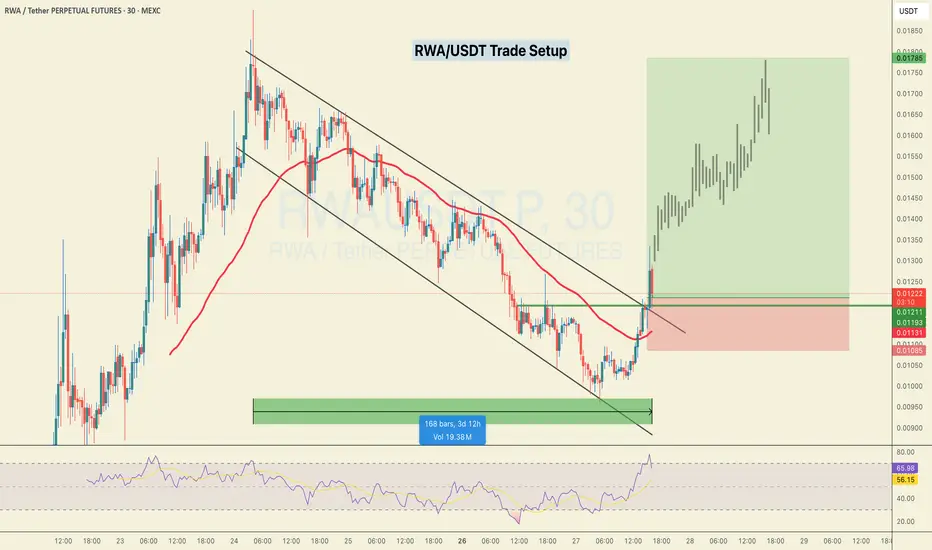
$RWA is ready for a massive 50% pump.About RWA:- Allo is building the world’s first exchange for tokenised stocks with 24/7 trading, low fees and instant settlement to democratize investing. Built on blockchain technology, Allo has tokenised $2.2B in RWAs, staked $50M in BTC, and launched a $100M lending facility.
The fundamentals look good, and so does the chart.
A massive breakout after 4 days of consolidation inside the channel.
ENTRY :- .01150 .01240
Target:- 1390, 1477,1558,1623,1785
SL : 1020
Keep the leverage low.
If you want me to post more setups like these, do show your support with a like.
Thank you
#PEACE
$RWA Breakout Setup LSE:RWA just broke out of the channel with strong momentum.
- Entry: NYSE:CMP
- Target: $0.01454 – $0.01900
- SL: $0.01064
DYRO, NFA

$RWA Breakout Alert – Trend Reversal in Play?LSE:RWA just broke out of a falling channel with strong volume — signaling a potential trend reversal.
It’s now retesting the breakout zone near the 0.382–0.5 Fib level, which could act as a support area before the next leg up.
If this reclaim holds, upside targets extend toward $0.017+—a 40%+ move from here.
Keep it on your radar.
DYOR, NFA.

$RWA Volume Decline Signals Bearish ContinuationAnalysis: LSE:RWA ’s price at $0.01 is accompanied by declining trading volume, indicating fading bullish momentum. The Parabolic SAR is above the price, signaling a downtrend. A break below $0.0095 could push prices to $0.007. Short with a stop above $0.0103 for a high-probability trade.
Indicators: Parabolic SAR, Volume
Timeframe: 1-Hour
Target: $0.007 | Stop Loss: $0.0103

$RWA Downtrend Confirmed Below $0.01Analysis: LSE:RWA has broken below the $0.01 support, confirming a bearish trend on the daily chart. The 20-day EMA ($0.0105) is acting as resistance, and the RSI at 35 shows no signs of reversal. Short with a target of $0.0078 and a stop above $0.0105.
Indicators: 20-day EMA, RSI
Timeframe: Daily
Target: $0.0078 | Stop Loss: $0.0105

$RWA Head-and-Shoulders Pattern Signals DeclineAnalysis: A head-and-shoulders pattern is forming on LSE:RWA ’s 4-hour chart, with the neckline at $0.0098. The price is testing $0.01, but weak volume and a bearish MACD crossover suggest a breakdown. Short below $0.0098, targeting $0.0075, with a stop above $0.0105.
Indicators: MACD, Volume, Head-and-Shoulders
Timeframe: 4-Hour
Target: $0.0075 | Stop Loss: $0.0105

$RWA Bearish Divergence Warns of PullbackAnalysis: LSE:RWA ’s recent rally to $0.01 shows a bearish divergence on the RSI, with lower highs despite price stability. The stochastic oscillator is in the overbought zone, suggesting exhaustion. Expect a drop to $0.0088 if $0.01 fails. Short with a stop above $0.011.
Indicators: RSI, Stochastic Oscillator
Timeframe: 4-Hour
Target: $0.0088 | Stop Loss: $0.011

$RWA Testing Critical $0.01 Support, Downside LikelyAnalysis: LSE:RWA is hovering at $0.01, but the Bollinger Bands are tightening, signaling potential volatility. The price is below the middle band ($0.0103), and the ADX at 30 indicates a strengthening downtrend. A break below $0.0095 could target $0.007. Short with a stop above $0.0105.
Indicators: Bollinger Bands, ADX
Timeframe: Daily
Target: $0.007 | Stop Loss: $0.0105
$RWA Overbought RSI Signals CorrectionAnalysis: Despite LSE:RWA ’s recent spike to $0.01, the RSI at 80 indicates overbought conditions on the 1-hour chart. A death cross on the 50/200 EMA is forming, suggesting a pullback. Short at $0.01 with a target of $0.0085 and a stop above $0.0105. Watch for declining volume to confirm the reversal.
Indicators: RSI, 50/200 EMA, Volume
Timeframe: 1-Hour
Target: $0.0085 | Stop Loss: $0.0105

$RWA Bearish Momentum Building at $0.01Analysis: LSE:RWA is showing a bearish flag pattern after failing to break $0.011 resistance. The MACD is diverging negatively, and the RSI at 40 suggests sellers are in control. A drop below $0.0098 could accelerate toward $0.0075. Short entries near $0.01 with a stop above $0.0115 are ideal.
Indicators: MACD, RSI, Bearish Flag
Timeframe: 4-Hour
Target: $0.0075 | Stop Loss: $0.0115

$RWA Faces Downside Risk Below $0.01 SupportAnalysis: LSE:RWA is struggling to hold $0.01, with a bearish breakdown below the 50-day EMA ($0.0102). The RSI at 45 is trending downward, and declining volume indicates weak buying pressure. A break below $0.0095 could lead to a test of $0.008. Short with a stop above $0.011 for a low-risk setup.
Indicators: 50-day EMA, RSI, Volume
Timeframe: Daily
Target: $0.008 | Stop Loss: $0.011

$RWA Bullish Reversal Forming at $0.01 SupportAnalysis: LSE:RWA is testing a strong support zone at $0.01, coinciding with the 200-day EMA. A double-bottom pattern is forming, signaling potential reversal. The MACD shows a bullish crossover, and increasing volume suggests buyer interest. If $0.01 holds, expect a push toward $0.0135. Enter long positions with a tight stop below $0.009. High risk-reward setup for patient traders.
Indicators: 200-day EMA, MACD, Volume
Timeframe: 4-Hour
Target: $0.0135 | Stop Loss: $0.009

$RWA Poised for Breakout Above $0.012 ResistanceAnalysis: LSE:RWA is consolidating near $0.01, showing signs of accumulation with a bullish triangular pattern forming on the daily chart. The price is holding above the 50-day EMA ($0.0098), and the RSI at 55 indicates room for upward momentum. A break above the key resistance at $0.012 could target $0.015, a 50% move. Volume spikes on recent green candles support bullish sentiment. Consider longing with a stop below $0.0095.
Indicators: 50-day EMA, RSI, Volume
Timeframe: Daily
Target: $0.015 | Stop Loss: $0.0095

RWA: $0.016 | from the Packager of BnB & PancakeswapUniswap took the defi space into another level which led to the birth of sushi 1inch and later comes PANCAKESWAP perfecting democratizing how a freshman neophyt gets into defi decental space
Valued at $6bn
--
BnB a platform dominating the global scene in ONBOARDING every joe in the world in getting a taste of how crypto would be a wondeful exciting exerceise
Valued at $100bn
------
ALLO RWA is CZs pet in the TOKENiZATiON era or generation which intends to serve the rising niche of getting access to Stocks Proroperty or just about anyting in the world
this one should be a Hit jst as Cake and Bnb did back in the day
==
STRATEGY: Fomo at whatever price before it TELEPORTS to $1bn
Cap Valuation $30M
artificially depressed to onboard future millionaires just like BnB many many moons ago
