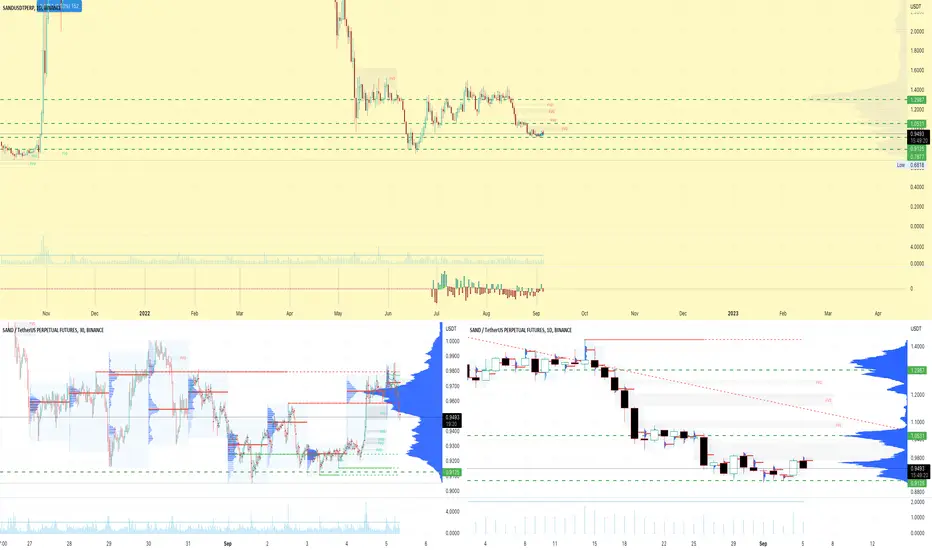
SANDUSDT DEEP CRABCrab
The Crab Pattern is a volatile 5-point extension structure that was discovered by Scott Carney in 2000. It has specific Fibonacci measurements for each point within its structure and it is important to note that D is not a point, but rather a zone in which price is likely to reverse, called the Potential Reversal Zone (PRZ). The B point retracement of the primary XA leg lies between 0.382 and 0.618 and the PRZ consists of 3 converging harmonic levels: 1) 1.618 extension of the primary XA leg, 2) AB=CD pattern, either equivalent, 1.27 or 1.618 and 3) Extreme BC projection of 2.24, 2.618, 3.14 or 3.618.
The first target would be the 382 retracement of AD and the second target the 618 retracement of AD. Common stop levels lie behind the next structure level after the D point or the 2.0 extension of XA. Conservative traders may look for additional confirmation. These patterns can be bearish and bullish. TradingView has a smart XABCD Pattern drawing tool to visually identify 5-point reversal structures on a chart.
SANDUSDT.3S trade ideas

SANDBOX- Updated LevelsSandbox is a project we like to Buy but always in good time and the timing ain't good at this stage.
Here is the charts with my 3 entry levels I'm looking at next.
0.59 is a strong support as much as 1.43 ended up being a strong rejection/resistance.
Patience Snoop and remember: smoking weed kills your brain cells, pass more than you puff.
One Love but no puff here yet,
the FXPROFESSOR

SANDSUDTIf the price breaks below its channel at the price 0.8567 before 08 September 2022 , the price will be in momentum and expect the price to reach 0.7967.
If it breaks below its channel, place a short position or sell order at 0.8445, take profit at 0.7970 and stop loss level at 0.8971.

SAND - time to fill liquidity gapslooking at these gaps on the 4h, and looking to take an even amount of profit off of each level, then throw stop loss to break even after the first 2.

SAND/USDT 1HOUR SETUP 💰Hello Guys 🎲
Price needs to collect liquidity from low levels to reject pivots.
Or if it stabilizes above the 2 pivot lines, the price will go up to the red resistance.
Arztoday Team ✨

SAND in cooking something 😋SAND is cooking something on Trendline can it give unbelievable breakout ?
Catch it OR watch it 🤗

SANDUSDT ANALYSIS#SANDUSDT Update
SAND is forming a small downtrend channel on the 4h chart, The resistance is $0.96-$1.00 and a break above $1.00 will start a new rally. The local support is $0.90 area and the next support is $0.80-$0.82 area. Wait for a break of the downtrend channel for new trades.

SANDUSD ❕ downward channelSAND has fallen below liquidity.
Price and RSI have formed a bearish divergence (1H TF)
The asset is testing the upper boundary of the descending channel.
I think price will be able to go lower if it holds inside the channel.

SAND is ready for breakoutHey, SAND is looking ready for a breakout - currently in pullback, entering with low leverage, taking profit around trouble areas... what do u think?
I feel bad about SANDUSDTBTC is losing it's support area and sand would be vulnerable in this scenario I would be careful
0.94-0.95 could be a support zone

SAND, stabilized and rebounded.The following are machine translations:
On the daily chart, it stabilized and rebounded after being supported near 0.91.
The indicator macd is about to cross the golden cross, the RSI indicator turns its head up near the oversold, and the indicator rebounds.
Summary: The pattern stabilizes and rebounds, and the indicator golden fork is trending upwards to see a rebound. The target is near 1.07, and it falls below the 0.9 stop loss.

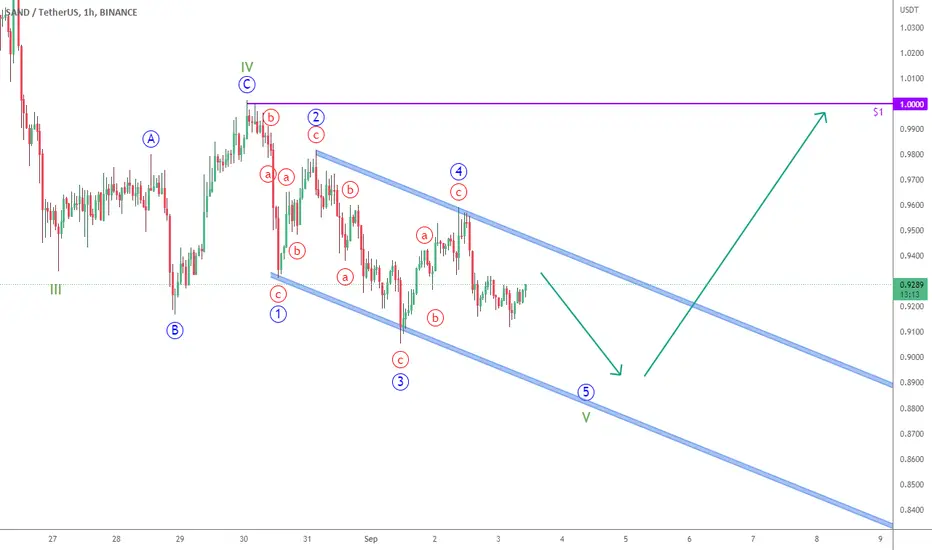
SAND - EW count for ending diagonalMy primary count considers that we´re in an ending diagonal, which would required one more leg down to form blue wave 5.
After this, I expect a short term recovery to test green wave 4 resistant (at round $1).
SAND TRIANGLE AT THE ENDsand in a great price to take long position also the stop loss tight (scalp)

$SANDUSDT UPDATE!!!Hi Snipers,
Please refer to the recording for the next price levels and scenarios.
Thanks
MS


SANDUSDT...buy and hold on this price..hello guys
sand in long-term formed in ascending parallel channel that once break down and move as wide as last channel.
in mid-term formed on descending parallel channel that move between top trend and middle line of channel.
in yellow triangle both of that approach match with each other and make that area very potential for long position.
always do your own research.
If you have any questions, you can write it in comments below, and I will answer them.
And please don't forget to support this idea with your like and comment.
BE PROFITABLE

#SANDUSDT 12H Chart
Price is currently ranging between the 8h demand zone and the resistance at $1. MACD is not clear, RSI is sold and EMAs are bearish. I expect price to trade deeper into the demand before moving up again.

SAND/USDT looking goodHey guys
We are back with SAND/USDT. From previous time one of scenarios activated where price fell to $0.94 zone from where we are setting our buys as well. This time it is a little bit hard to get the best entry as we still might see a correction towards another support so that why we are entering with ladder entries!
Our Yellow lines are Take-profit zones)) This is just an idea of what could happen with Sandbox.
If you like ideas provided by our team you can show us your support by liking and commenting.
Yours Sincerely,
Swallow Team 🔱
Disclamer:
We are not financial advisors. The content that we share on this website are for educational purposes and are our own personal opinions.

Quick sandI don't know what is SAND but it's clearly devouring investors like quick sand.
SANDUSDT collapsed a month ago, when $1.2 was broken.
Expecting retest of May low. After that we will likely see a small bounce followed by another series of price collapse.

SANDUSDTWhen the price trend reaches the specified zones, if you see the entry trigger, you can enter the transaction and set the first target twice the loss limit.
Be careful not to enter the transaction without an entry trigger.

SANDBOX - Snoop, pass pass passRejection at 1,43 was harsh and persistent, Powell brought SAND and the market lower and unfortunately this is not a dip to buy (yet)
With Mt Gox fears being valid (nobody knows for sure how and when the event will take place) and after Powel's gloomy projections/tone we need to be worried.
I would be Long over 0.99or at 0,75 again. Grand support very far away at 59 cents.... can't guarantee nor wish that we can see this level again but reality says we could.
Let's keep our cool and be aware that markets opening in Asia tonight (Sunday midnight hours for Europe) could add to worries.
We be careful and hedged here. SANDBOX is a crypto I like to Buy.
One Love,
the FXPROFESSOR

The last bastion of supportHello, dear TradingView members.
SAND has hit a support range at $1.13 to $1.185 over the past week as it continues its downward trend. Due to the strong selling pressure, the support strength was not enough to hold the price, and after breaking this support, we saw a further drop to the $1 range. In the past few days, the price trend of the sandbox has ranged, and the previous day, the $1 support of the sandbox was also broken due to negative news that had a negative impact on the entire market.
The price has now hit support in the $0.94 range, and if this range holds, another bearish trend is expected for the currency. But if the selling pressure increases, by breaking this support, the price can continue the downward trend to the previous floor in the range of 0.69 to 0.76 dollars. In the weekly time frame, the main support is the floor of its last rising wave, and if it is broken, the $0.61-$0.65 range will be its last support level for the medium term.
Good luck!

SANDUSDT | SUPPORT ZONESANDUSDT has been in downtrend and price is making lower lows and lower highs. The price has been now trading within a range. The price has approached to horizontal support zone . The bulls can show some strength from here. The bullish candles formation on support will only confirm the holding of support.
We are watching out the price action on support.
The bulls need to hold the support. While break below support zone will bring bears in party.
Trade your levels accordingly.
