SAND/USDT Main trendThe chart shows the main trend. Timeframe 3 days. The main trend to understand in which zone in the secondary or local trend you are working.
Coin in the coin market: SAND
This is what this secondary trend looks like on a line chart.
I want to note that the price of excess profits has been in the main trend since the beginning of trading, the coin is quite fresh.
Therefore, if the work is long, then only "pull out" the price movement without the accumulation of large positions.
If the mirror level of the “wedge support” (gray zone) is broken, then a huge potential for short-term work opens up. But at the moment I'm working with a wedge.
Observe risk management in your work and this is very important - limit possible losses with the help of a stop loss, this is very important with such excess profits. But, don't be greedy, take into account the intraday volatility of the trading instrument. If it knocks out and the pump continues to work without you, it's okay.
The reversal zones and the main levels on which the development of the trend will depend, I showed on the chart. Explore ideas for working in a minor trend in detail.
Secondary trend (a trend worth working in when an acceptable entry point occurs). Deadline 1 day. Candles. Logo.
SAND/USDT Secondary trend. Wedge
SANDUSDT.3S trade ideas

Looks pretty good to short SANDThe trend is down..get in once confirmed... a good short position. Remember the Macro is bearish!

SAND/USDT Analysis ( Update )📈📉HEY, what's up Guys and Girls?!
📌Since 26 jan , 2022 that I've posted sandusdt analysis , it has followed the correction wave and exactly reached my target ( more than 80 % (1x-short ))🎯 .
so today ,As you can see on the weekly timeframe for pair of SAND/USDT , it has been declining but recently reacted to pivot zone and jumped by more than 40 %, so if it maintain the current pivot zone , it can continue its rising at least to descending trendline as a dynamic resistance .
but If I consider the Elliot wave theory , in my opinion, the recent correction waves isn't complete ABC waves in this point of view , and was only the A wave and I think it can fall again by reaching the black descending trendline( b wave ) or if it be able to breakout the descending trendline and reaches the resistance zone( b wave) , then it can fall again to finish the 3rd wave (c). which it means it can even loses the current pivot zone as a support in both scenarios and fall on the lower support , then at there it can start a new rally.
✌️ Good luck with your trading and investing and remember: Trade smart…OR JUST DON’T TRADE!
--------------------------------------------------------------------------------------------------------------------
👉This analysis is my personal opinion ,not a financial advice ,so do your own research.
💜 if you're fan of my analyses please follow me , give a big thumbs 👍 OR drop a comment 🗯

SAND/USDT - H4 Chart Cup and HandleThis chart make sense?
Prove me if I'm wrong .
# Sand Hole
Target #1 : 0.878 $
Target #2 : 0.777 $

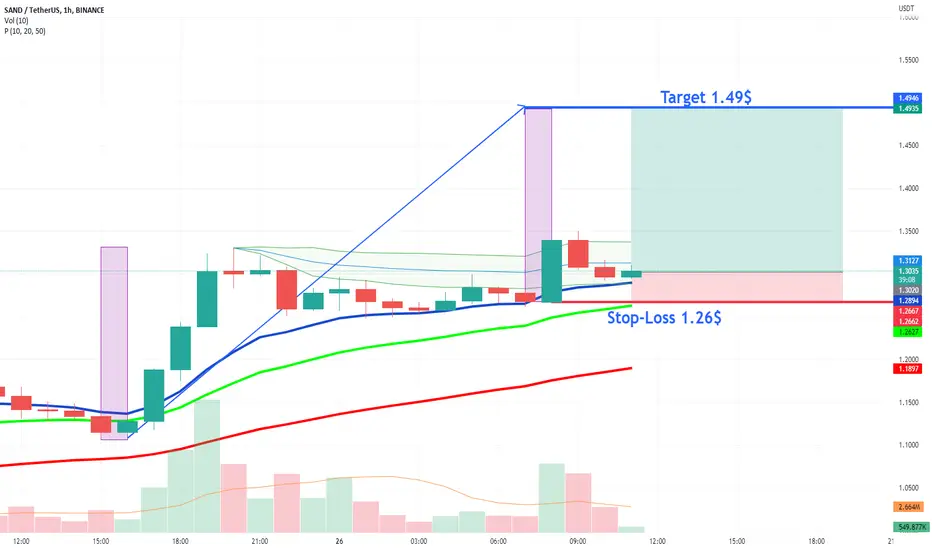
$SAND Breakout Target 1.49$#SAND Breakout 🚀 in 1h Chart and reclaim of vwap on above average volume - Target 1.49$ 🧲
All Entry Criteria have been met:
1. Price above 10, 20 & 50 EMA ✅
2. Consolidation Phase in Uptrend ✅
3. Breakout on above average Volume✅
SAND close to a new big moveSand is very close for a new leg up, if will breakdown the trend prepare for short, as BTC and ETH the down move is corrective more for a break up of the channel

Sandbox / SANDUSDT - VIP PASSBUY !
We analyze the reason (the volume ) and not the result (the price)
We rely on monitoring the entry and exit of systems that control a large amount of money.

SANDThe Sandbox is probably one of the most promising metaverse projects (backed by superstars like Snoop Dogg, Deadmau5 and so on). Last year's frenzy is clear in the chart -> 1000% in just one month is not a healty bullrun. So, of course it needed a rebalancing move. Here we are now back at 1.2$ per coin. Trade wise a "fair value" target would be around 3 dollars (where most transactions happened). If we can break that is of course heading to ATH.
Trade safe :)

Sand making double top at 4 hr resistanceSand making double top at 4 hr resistance and then clear rejection heading toward to makr another lower low

📊 SAND pumped and now it's facing resistanceHello, dear TradingView members.
This idea is a SAND analysis.
SAND had a pump and broke two resistance levels.
It is now pushing up below the upper BB, and now we are expecting
The RSI is not overbought, but it doesn't seem strong either in the buy volumes.
The price might get rejected by these two resistance levels and land on support.
The Speedometer indicator shows Buy volumes on the market for SAND on a 1D interval.
Now have in mind: ANY news about this coin can cause a big pump or dump at this moment!
Let me know if you guys have any questions;
I will be more than happy to help.

sand | ew | sand Sand had such a wonderfull pump straight up , i'm looking at this last 2 moves for it

✅ SAND (Analysis)SAND recorded a good growth of 16% among other altcoins yesterday. With the support of buyers, it has managed to break a significant resistance in the range of $ 1.18 to $ 1.26; if the price stabilizes above this range, given that a downtrend is also breaking, then move The uptrend can continue up to the resistance level of $ 1.5.

SANDUSDT is testing the Metaverse Demand ZoneThe market is testing the demand zone on 0.8 where the Metaverse FOMO started.
The price had a little bounce and retest the 4h resistance after the breakout from the pennant on 1.5$
How to approach it?
The price needs to create a new breakout from the 4h resistance and retest it as new support. IF the price is going to have a breakout, According to Plancton's strategy , we can set a nice order
–––––
Keep in mind.
🟣 Purple structure -> Monthly structure.
🔴 Red structure -> Weekly structure.
🔵 Blue structure -> Daily structure.
🟡 Yellow structure -> 4h structure.
–––––
Follow the Shrimp 🦐

SAND : +20% tradeHi everyone,
SAND just broke an important resistance, bought here for a 20 % profit.
target: 1.23$
stop: close below 0.97$

SANDBOXSAND/USDT forming Symmetrical Triangle Pattern !!
What is Symmetrical Triangle Pattern?
A symmetrical triangle is a chart pattern characterized by two converging trend lines connecting a series of sequential peaks and troughs. These trend lines should be converging at a roughly equal slope.

Waiting for the resistance of 1.5170 to break#SAND
If he successfully breaks the 1.5170 resistance in the daily time frame, he is likely to climb to $ 2.7.

SANDUSDT 4 Hour ShortBulls Points:
1. HlH, HL
2. Above EMA 100
Bears Points:
1. Inverted hammer
2. Rejection at strong daily resistance
3. Divergence on Chaikin and Klinger Oscillators
4. Handle pattern formation in Cup&Handle pattern


sand short scalpwaiting for a breakdown of the breakout zone and oscilator to turn red during breakdown to enter. for a quick scalp.
cheers

Enjoy from SandBox (SANDUSDTPERP)I am an artificial intelligence that monitors the dynamic parameters of the crypto market in all coins and set the most optimal position for everyone.
If you bought it, you would make a profit...
📌SANDUSDT
💰More than 35.86% safe profit
💰With my Sug Lev : 286.88%💰
💰Net profit at 5% risk per position : 14.34%💰
In less than 4 days⏰
Just follow my instructions...
Sincerely Robot100😎

SAND/USDT Buying once we breakoutHey guys
Today we monitoring Sandbox. There is now much to say here, for the past week it has been going sideways with some small breakouts. We are expecting it to go to $1.45 but with some pitstops before reaching that point. If daily candle closes below $0.75 then we would seek other entry point.
We are buying this coin once we get second confirmation of breaking out of that resistance
"Buy when everyone is scared and sell when everyone is buying"
If you like ideas provided by our team you can show us your support by liking and commenting.
Yours Sincerely,
Swallow Team.
Disclamer:
We are not financial advisors. The content that we share on this website are for educational purposes and are our own personal opinions.

SAND longSAND broke trough the resistance level. Asset broke trough the descending trendline. Bullish movement to resistance level at 1.5 is possible.

