SANDUSD ❕ lower boundary of the channelSAND broke below 50EMA on 1H TF.
The 50EMA crossed down through the 200EMA on the 1H TF.
RSI chart is moving in bearish zone (1H and 30m TFs)
The asset will decline after exiting the channel.
SANDUSDT.P trade ideas
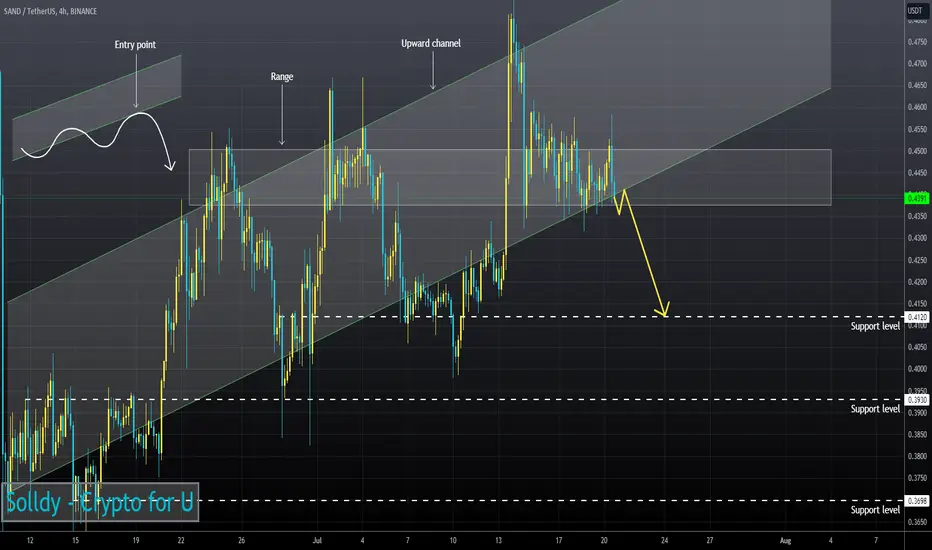
SANDUSDT relevant support and resistance levelsThe price bounced from weekly support WS1 and head towards 4h resistance 4HR1. From there it was rejected and pulled back. It seems logical that the price will visit the daily support again before attempting the 4h resistance 4HR1 again. Anyways, a long is favorable from daily support if the price reaches there. Overall all the relevant supports and resistances are marked and the principle remains same: long the support and short the resistance.


Brief Analysis —— SANDThe preliminary result to the lawsuit of XRP and the SEC was released yesterday. The court held that XRP does not meet the characteristics of securities in the secondary market, but meets the HOWEY judgment in the primary market. This result is interpreted as a victory for XRP, but also for the crypto market.
After that, XRP was relisted by the exchange such as Coinbase and pumped. Many tokens that were defined as securities last month followed up. Today we have selected three tokens that were once defined as securities to share. AVAX\USDT, MATIC\USDT, SAND\USDT
Although SAND had gains of more than 13% yesterday, it is not a big deal for the decline after being defined as a security. The price was near the high point of early July and did not recover the decline of early June like many other tokens. This has caused SAND to maintain bearish on a large scale. The trend is more like maintaining fluctuation in the past month.
Conclusion: Mostly fluctuation. The long green candle yesterday was more likely to be carried by the market. Up until yesterday, there was little momentum to move up. And at the current price, the previous low can still provide resistance, so we come to this conclusion. We set resistance level at 0.495, which is the lower rail of the previous range, and support level at 0.362.
If you have any ideas, welcome to communicate with us:)
Disclaimer: Nothing in the script constitutes investment advice. The script objectively expounded the market situation and should not be construed as an offer to sell or an invitation to buy any cryptocurrencies.
Any decisions made based on the information contained in the script are your sole responsibility. Any investments made or to be made shall be with your independent analyses based on your financial situation and objectives.

Sand Almost Ready For Massive Breakout Seems Like Has Already bottomed Out & Breaking Descending Channel incase Of Successful breakout expecting Move towards 2$ For Buying Opportunities Lower Tf Breakouts

Sand OutlookI expect a bounce from the current price to two mentioned targets. SAND has been recently added to allowed trading crypto in Hong Kong which pumped the price. Afterwards, it was target by SEC and labelled as a security and price dumped. I am following this token for years now. It is a mid-risky token; therefore, you can take the huge plunge from $0.61 to $0.33 by SEC as a buy opportunity.

SAND Sandbox and the Altcoin Season ThesisIf you haven`t sold SAND here:
or bought it back here:
Then the recent developments in the cryptocurrency market, particularly the favorable court ruling for Ripple Labs, signal an optimistic start to a new altcoin season.
With the federal judge ruling that some of Ripple's sales of the XRP token do not fully meet the definition of a securities offering, it instills confidence in the altcoin space.
This ruling brings clarity to the regulatory landscape and alleviates concerns surrounding XRP, leading to major cryptocurrency exchanges, including Coinbase, relisting the token. The reintroduction of XRP to these platforms demonstrates growing acceptance and renewed interest in this altcoin.
The anticipation surrounding the approval of a spot bitcoin ETF in the United States adds to the positive sentiment in the market.
The successful launch of a previously approved ETF in Europe further reinforces the upward trend for altcoins.
The recent court ruling that declared XRP as not a security sets a precedent that could potentially benefit other cryptocurrencies currently classified as securities by the SEC. In the SEC's case against Binance, they designated 10 cryptocurrencies, including BNB, BUSD, SOL, ADA, MATIC, ATOM, SAND, MANA, AXS, and COTI, as securities.
Additionally, in the SEC's lawsuit against Coinbase, they named 13 cryptocurrencies, reinforcing their stance on SOL, ADA, MATIC, SAND, and AXS, and adding CHZ, FLOW, ICP, NEAR, VGX, and NEXO to the list.
This development showcases the increasing institutional acceptance of cryptocurrencies and creates a ripple effect across the market, providing a boost for various altcoins, including SAND Sandbox, for which my price target is $0.60.
Looking forward to read your opinion about it!

Sand USDT Weekly/ Swing Trade IdeaSand is in a range and range lows have been hunt/liquidity swept.
There's liquidity between 0.15 Cents to .20 Cents.
There's a ton of liquidity at range highs $1. After sweeping range highs and back in range, it is highly probable that this range was distribution and new lows are likely.
Indicators
--Every indicator is reset to move higher.
--Bullish divergences
This aligns with the assumptions:
1- Alts will rekt as BTC.D will rise. New and all money flow back only into BTC and ETH.
2- Alts have absurd valuations. FDV or even MC in hundreds of millions and revenue non-existent.

Sand/USDT 1 WeekAccording to my analysis and based on these assumptions, it is very likely alts will fall dramtically. This is for the reason alts are over valued. FDV or even market cap doesn't justify their valuations.
Sand has nearly a billion dollar coin yet has no basic utility. Graphics feel like 80's. Not yet delivered as promised.

SAND USDT PERP Hello Trader BINANCE:SANDUSDT.P
pairs sand usdt 4-hour time frame has touched the resistance area but for the resistance area to touch the liquidation area for retailers, the possibility of bearish for this pair will be able to swing but please monitor for confirmation area breakdown in the support area.
Please add a comment and Positive feedback and
constructive criticism are important to authors and the
community.
Disclamer: Not Financial Advice

sandusdtA five-wave C wave, in order for a flat pattern to appear in three large waves for the shaded area
Note: the analysis fails if the price closes below the 0.33 usdt area

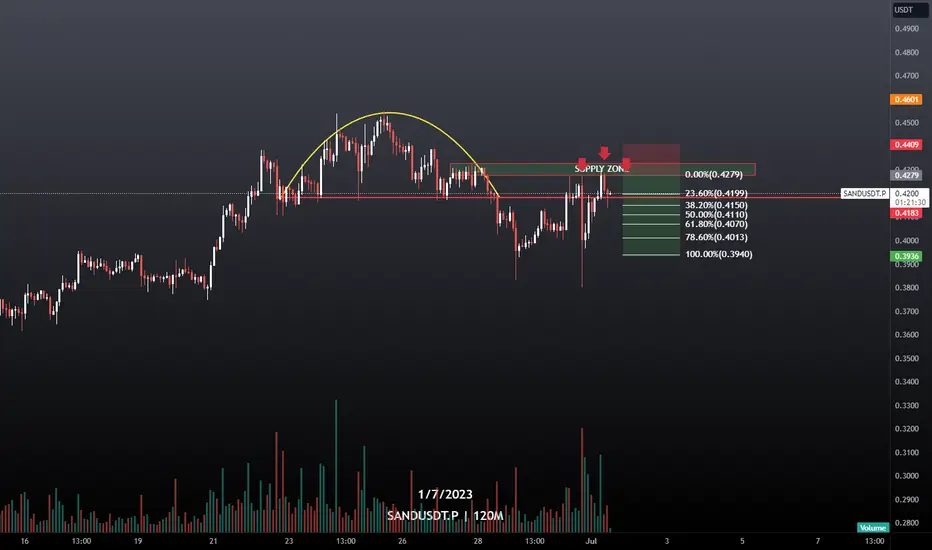
SAND USDT PERP Hello Trader 👋, today we are looking to BINANCE:SANDUSDT.P
rounding top for sand usdt pairs. supply zone has rejected to go down and has also confirmed to sell the area at 0.4279.
Please add a comment and Positive feedback and
constructive criticism are important to authors and the
community.
Disclamer: Not Financial Advice
SAND/USDT Important Supply ZoneIt seems that the areas ahead can be very attractive for price reversal.
For me, scenario 1 is more attractive. Because there is a good overlap with the bearish trend line
However, do not enter the transaction without confirmation

SAND Sandbox Technical ReboundIf you haven`t sold SAND here:
Then in my opinion, based on the analysis of SAND's chart patterns, I can see the potential bullish signals suggested by the double bottom and falling wedge patterns.
These patterns often indicate a reversal or continuation of the current trend, which makes me optimistic about the stock's future performance. Considering the support found at the double bottom and the narrowing price range in the falling wedge, it appears that buyers are entering the market, and there is potential for an upward price movement.
Given these chart patterns and my analysis, I have set a price target of $0.50. I believe that a technical rebound leading to such a price level is feasible based on the signals observed.
Looking forward to read your opinion about it.

SAND Finds Hidden Bulls ..2 USD Is Ready..#SANDUSDT is bullish on daily timeframe. It holds support and downside trendline liquidity is very juicy on upside. So it may go up to eat upside liquidity. 2 dollar is easy for #SAND.

SANDUSDTP.SANDUSDTP. forecast plan since its break down the previous low so from my wave count I see it as correction not the new wave yet.

SAND/USDT Key Support Reclaimed & Potential for Upside MovementHello Traders,
Introduction:
The crypto market is a fertile ground for traders who know where to look. Today, our focus is on the SAND/USDT Perpetual pair on Bybit, specifically on its 1d chart. An interesting long setup seems to be developing.
Body:
Key Support Reclaimed: The price recently reclaimed a significant support level at $0.3805. This development often suggests a potentially bullish price action in the making.
POC Level: The Point of Control (POC) from January 1, 2023, to today stands at $0.52. This key level can act as a magnet for price action, possibly pulling the price towards it.
Liquidity at $0.48: There's considerable liquidity in the $0.48 area, where a previous support breakdown led to a substantial drop. The price might rally to this level to fill this inefficiency.
Bullish Stoch RSI: The Stoch RSI has crossed upwards and is above the 20 level, indicating rising bullish momentum.
Stable RSI: The RSI currently stands at 40, with no noticeable divergences. This stability suggests that, for now, the current price level is holding.
Trade Setup:
With these factors in mind, I've decided to take a long position on SAND/USDT. My invalidation point for this trade is a close of a 1d candle below $0.3805, which would suggest a breakdown below our reclaimed support.
Take Profit Targets:
TP1: The first take profit target is set at $0.48. This level represents the area of high liquidity, which can act as a resistance level.
TP2: The second take profit target is the POC level of $0.52. This level has historically attracted price action and could potentially do so again.
Conclusion:
While this setup seems promising, remember that trading carries inherent risks, and it's crucial to have proper risk management in place. Always be prepared for any scenario, and never invest more than what you can afford to lose.

SANDUSDTI am still expecting a drop for SANDUSDT. Resistance seems to be holding really nicely. Just have to wait and see how it plays out.

SANDUSDTWhat Is The Sandbox (SAND)?
Launched in 2011 by Pixowl, The Sandbox is a blockchain-based virtual world allowing users to create, build, buy and sell digital assets in the form of a game. By combining the powers of decentralized autonomous organizations (DAO) and non-fungible tokens (NFTs), the Sandbox creates a decentralized platform for a thriving gaming community.

Is the rise over?I think that the ascent ended with the creation of five small waves to complete the C wave and start a new, final and strong bearish impulse wave

Long Sand/USDTI am going to long sand/usdt for possible 2.5% (without leverage). Since this is a scalp position I expect price touch TP or SL in a short period of time.

#SANDUSDT Profit Analysis Update ( 37% Down from our TA#SANDUSDT Profit Analysis Update:
NYSE:SAND is currently trading at $0.39, which represents a 37% decrease from our previous analysis. If you followed our suggestion to short, we hope you earned significant profits. However, even if you didn't short, you still saved your money as it's now down by 37% from that level.
The impact of the SEC lawsuit has caused a substantial 45% decline in NYSE:SAND 's price.
Looking ahead, we anticipate a potential upward move before another leg down towards the $0.2-$0.150 range. Keep a close watch on the $0.380 support level. If it holds, we may witness an upward move towards $0.55 before the subsequent downward movement.
However, if the current support at $0.380 fails, we could see another significant drop.
Our expectation is that NYSE:SAND may reach the $0.2-$0.15 range by the end of this year, presenting excellent buying opportunities for long-term holders.
In the next bull run, we anticipate NYSE:SAND potentially hitting $10, representing nearly a 50x increase from the lower support area.
Please note that this analysis reflects our personal opinion and is not financial advice. We encourage you to conduct your own research before making any investment decisions.
Thank you.
