TradeCityPro | SAND: Critical Support Test After Pullback👋 Welcome to TradeCity Pro!
In this analysis, I want to review the SAND coin for you. It’s one of the most popular Metaverse projects, widely recognized and among the top in its category.
✔️ This project’s coin currently holds a market cap of $693 million and ranks 91st on CoinMarketCap.
⏳ 4-Hour Timeframe
As you can see on the 4H chart, after a bullish leg that pushed the price up to 0.3140, a correction phase began. Following the break of 0.2903, the price has now corrected down to 0.2714.
🔍 If this 0.2714 level breaks, the price could continue down to the support at 0.2437 — so a break below 0.2714 would be a valid short entry.
👀 Personally, I prefer waiting for the price to first bounce off 0.2714, move upward, and print a lower high relative to 0.2903, then break 0.2714 on a second attempt. In that case, the short setup becomes much more reliable.
🔽 That said, even if the level breaks now without a bounce — since RSI is already near the oversold zone — I’ll still open a short. If RSI enters oversold, it could lead to a sharp drop.
⚡️ One negative factor for short positions is that volume has been decreasing since the price started correcting from 0.3140, which isn't a good signal for further downside — there’s a divergence between price and volume.
📈 However, that’s a positive signal for potential long positions. When volume drops during a correction in an uptrend, it shows buyers still have control. As long as this divergence persists, the uptrend is more likely to continue than to reverse.
📊 For long positions, if buying volume enters the market and the price holds above 0.2714, you can enter based on lower-timeframe structure breaks. The main long entry will be confirmed once the price breaks above the 0.3140 high.
📝 Final Thoughts
This analysis reflects our opinions and is not financial advice.
Share your thoughts in the comments, and don’t forget to share this analysis with your friends! ❤️
SANDUSDT.P trade ideas

SANDUSDT 1D AnalysisSAND ~ 1D Analysis
#SAND Buy gradually after successfully penetrating this resistant line with a short -term target of at least 15%+.

sand long longterm spot "🌟 Welcome to Golden Candle! 🌟
We're a team of 📈 passionate traders 📉 who love sharing our 🔍 technical analysis insights 🔎 with the TradingView community. 🌎
Our goal is to provide 💡 valuable perspectives 💡 on market trends and patterns, but 🚫 please note that our analyses are not intended as buy or sell recommendations. 🚫
Instead, they reflect our own 💭 personal attitudes and thoughts. 💭
Follow along and 📚 learn 📚 from our analyses! 📊💡"

SANDUSDTshort selling set up 📉
DISCLAIMER:
what I share here is just personal research, all based on my hobby and love of speculation intelligence.
The data I share does not come from financial advice.
Use controlled risk, not an invitation to buy and sell certain assets, because it all comes back to each individual.

The Sandbox: Your Altcoin ChoiceLet's continue with Your Altcoin Choice. Some analysis can take a while, but all will be done.
The Sandbox is in a very good situation as shown on the chart. The price range marked with light blue is a long-term support and also a confirmed buy zone. The last wave, amounting to more than 375%, came out of this zone. After a correction and long-term higher low, SANDUSDT is ready to go at it again.
This chart shows potential for a "small wave" relatively speaking. Small in relation to the potential The Sandbox has for the full bull market. See this chart below:
Notice the big difference. This one has a total potential of more than 5,000%. This would include the bull market bull run phase which is not included in the first chart.
The previous bullish cycle, from November 2020 through November 2021 produced total growth of 29,371%. There was a stop, a correction between March and June 2021 lasting 87 days. After this the last bullish jump.
This is what needs to be kept in mind for this cycle. 87 days but much more growth happened afterward. With all the sideways action in these transition years, we get used to seeing a stop after just one wave. When the market is full blown bullish, this stop is only temporary and after it ends we get the resumption of the bullish wave.
We have been seeing sideways, the bull market is an uptrend. This is a big difference and something to keep in mind. Crypto will grow.
Bitcoin, The Sandbox, Gala Games, Cardano and much more.
Thanks a lot for your continued support.
Namaste.

SAND at a Key Turning Point – Breakout or Breakdown?🔥 SAND Daily & Weekly Update!
📉 Daily TF: Price remains inside a falling wedge—this pattern often signals a reversal. Keep an eye on breakout signals!
⏳ Weekly TF: After breaking out of a descending triangle, price is now retesting trendline support—this is a critical level for confirmation.
⚡ Retest Watch: If support holds, a strong move could follow. Bulls need to step in!
👀 Will buyers defend this zone, or is a deeper retracement coming? Stay ready! 🚀

SAND - Nice Snipinig levels played out. i wrote : "Currently this green move through small blue box is like a Short Squeeze."
Boom ! it was a short squeeze 🧐 👌 🎯
Look how impulsive those red ad green candles pierced the blue box.
Look how that hVn level was accurate. To the point !
I was expecting less profit but numbers like 5 % and almost 10 % are really good. 💰💵💲
Original TA/Signal:https://www.tradingview.com/chart/SANDUSDT.P/XZIoklWZ-SAND-new-Levels/
Follow for more ideas/Signals. 💲
Look at my other ideas 😉
Just donate some of your profit to Animal rights and rescue or other charity :)✌️

SANDUSDT 1WSAND ~ 1W Analysis
#SAND Buy from here if you still have a Conviction on this coin with a short -term target of at least 20%+.

#SAND #SANDUSDT #SANDBOX #LONG #SWING #AMD #Eddy#SAND #SANDUSDT #SANDBOX #LONG #SWING #AMD #Eddy
SANDUSDT.P SWING Long AMD Setup
Important areas of the upper time frame for scalping are identified and named.
This setup is based on a combination of different styles, including the volume style with the ict style. (( AMD SETUP ))
Based on your strategy and style, get the necessary confirmations for this Swing Setup to enter the trade.
Don't forget risk and capital management.
The entry point, take profit point, and stop loss point are indicated on the chart along with their amounts.
The responsibility for the transaction is yours and I have no responsibility for not observing your risk and capital management.
By scratching the price and time bar, you can see the big picture and targets.
Note: The price can go much higher than the second target, and there is a possibility of a 50%-100% pump on this currency. By observing risk and capital management, obtaining the necessary approvals, and saving profits in the targets, you can keep it for the pump.
Be successful and profitable.

SAND - new LevelsCurrently this green move through small blue box is like a Short Squeeze.
For me that upper bigger blue box is more interesting for a Short.
A short right now would be 60/40 chance for a win.
I wait, but the POC could be nice 2% Short possibility too :)
Follow for more ideas/Signals. 💲
Look at my other ideas 😉
Just donate some of your profit to Animal rights and rescue or other charity :)✌️

SAND/USDT 1W🩸 NYSE:SAND ⁀➷
#TheSandbox. Macro chart Another
💯 Intermediate Target - $1.36
🚩 Macro Target 1 - $2.03
🚩 Macro Target 2 - $3.44
🚩 Macro Target 3 - $5.50
- Not financial advice, trade with caution.
#Crypto #TheSandbox #SAND #Investment
✅ Stay updated on market news and developments that may influence the price of The Sandbox. Positive or negative news can significantly impact the cryptocurrency's value.
✅ Exercise patience and discipline when executing your trading plan. Avoid making impulsive decisions driven by emotions, and adhere to your strategy even during periods of market volatility.
✅ Remember that trading always involves risk, and there are no guarantees of profit. Conduct thorough research, analyze market conditions, and be prepared for various scenarios. Trade only with funds you can afford to lose and avoid excessive risk-taking.

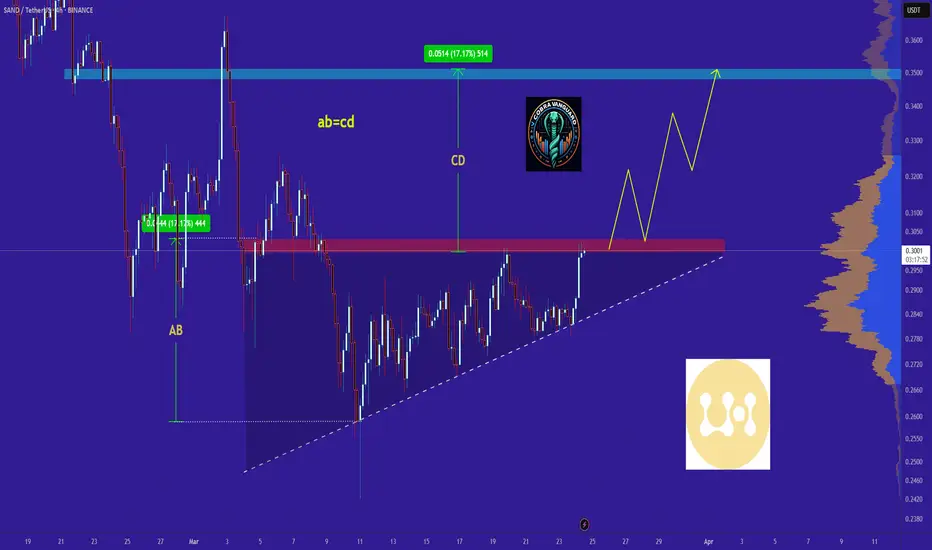
SAND in coming days ...Currently, SAND is forming an ascending triangle, indicating a potential price increase. It is anticipated that the price could rise, aligning with the projected price movement (AB=CD).
However, it is crucial to wait for the triangle to break before taking any action.
Give me some energy !!
✨We spend hours finding potential opportunities and writing useful ideas, we would be happy if you support us.
Best regards CobraVanguard.💚
_ _ _ _ __ _ _ _ _ _ _ _ _ _ _ _ _ _ _ _ _ _ _ _ _ _ _ _ _ _ _ _
✅Thank you, and for more ideas, hit ❤️Like❤️ and 🌟Follow🌟!
⚠️Things can change...
The markets are always changing and even with all these signals, the market changes tend to be strong and fast!!
Holding SandUSD, good crypto project with good narrative.Long-term project, an estimated 1329% profit after maybe months. With the Crypto policy in the United States. Knowing that cryptocurrencies are in free fall and the markets are under pressure. Let's be on the lookout for information that can allow us to bet on this project or to abandon it at the best time.
And you, do you trust or not the evolution of the cryptocurrency markets..?

Channel**SAND/USDT – 15-Minute Chart Analysis**
The price has formed a **double bottom** near the **0.3040 - 0.3027** support zone and is showing signs of bullish reversal. A breakout from the short-term downtrend structure has occurred, and a **higher low** is forming.
Entry has been taken at the breakout with a target around **0.3206**, which aligns with a previous resistance level. The stop-loss is set below the recent support zone.
🟢 **Trade Management**: Close **half of the position** at **TP1** to secure profits and let the rest run.


$SAND Sandbox Over 70% Retracement... Ready for Higher?NYSE:SAND Sandbox has committed a over 70% retracement after superbuy signal from a height of approximately $1
Current Price: $0.36
Price action is forming a Falling Wedge and Bullish Divergences Spotted also
Expecting a retest of previous supports - now resistances at 0.41, 0.54, 0.7, 0.82, 0.96
#sand Invalidation is at under 0.3

sandMy personal opinion is to buy in the specified area below. It should be reviewed according to market conditions.

SAND LONG SETUP ENTRY : 0.27299
PROFIT : 0.37002
STOP : 0.24579
ALL trading ideas have entry point + stop loss + take profit + Risk level.
hello Traders, here is the full analysis for this pair, let me know in the comment section below if you have any questions, the entry will be taken only if all rules of the strategies will be satisfied. I suggest you keep this pair on your watchlist and see if the rules of your strategy are satisfied. Please also refer to the Important Risk Notice linked below.
Disclaimer

Is There Hope for Sandbox ($SAND) or Is The Gameverse Dead?The Decline of NYSE:SAND : A Look at Its Current State
Once a shining star in the play-to-earn (P2E) gaming and NFT ecosystem, Sandbox ( NYSE:SAND ) has seen a staggering decline from its all-time high of $8.44 to a mere $0.34 at the time of writing. This sharp drop has left investors and gamers questioning the future of metaverse gaming and the sustainability of blockchain-based virtual worlds.
Despite recent hype around Web3 gaming and metaverse adoption, the broader NFT and P2E sectors have remained relatively muted, contributing to NYSE:SAND ’s price drop. However, does this spell the end for The Sandbox, or is a reversal on the horizon?
Technical Analysis
The Relative Strength Index (RSI) currently sits at 23, indicating that NYSE:SAND is in heavily oversold territory. Typically, an RSI below 30 suggests that an asset is due for a rebound, as selling pressure diminishes.
The daily chart is forming a rising wedge pattern, which is a traditionally bearish formation. If the pattern holds, further declines could be expected. However, the $0.39 pivot zone is a critical resistance level. Should NYSE:SAND manage to break above this level, it could spark a campaign towards the $1 mark, a move that would be monumental for the token.
Currently, NYSE:SAND is down 7.27% on the day, with a 14% decline over the last 24 hours. The lack of bullish momentum suggests that investors remain hesitant about a potential comeback. However, if volume spikes and momentum shifts, a short-term recovery could be on the table.
Market Data & Sentiment
- Current Price: $0.3487
- 24-Hour Trading Volume: $113.85 million
- Market Cap: $859.36 million
- Circulating Supply: 2.46 billion NYSE:SAND
Despite the downturn, The Sandbox maintains a top-100 ranking in the crypto market, proving that it still holds relevance. The challenge now is for the platform to reignite user interest and expand beyond its current stagnation.
The Road Ahead: Dead or Dormant?
While the NFT and metaverse hype has faded, it doesn’t necessarily mean the sector is dead. Innovation, adoption, and strategic partnerships could breathe life back into NYSE:SAND and other metaverse tokens.

Be careful with SAND !!!The price has formed a bullish wedge on the 1h time frame, and if it breaks out, it can drive the price up to around $0.43.
Give me some energy !!
✨We spend hours finding potential opportunities and writing useful ideas, we would be happy if you support us.
Best regards CobraVanguard.💚
_ _ _ _ __ _ _ _ _ _ _ _ _ _ _ _ _ _ _ _ _ _ _ _ _ _ _ _ _ _ _ _
✅Thank you, and for more ideas, hit ❤️Like❤️ and 🌟Follow🌟!
⚠️Things can change...
The markets are always changing and even with all these signals, the market changes tend to be strong and fast!!

SANDUSDT 1WSAND ~ 1W Analysis
#SAND Buy gradually from here if you still have a Conviction on this Coin with a minimum target of 20%+

SAND → 𝐁𝐮𝐥𝐥𝐢𝐬𝐡 𝐏𝐫𝐞𝐬𝐬𝐮𝐫𝐞 !!!Buy at 37 cents and sell at 41 and 56 cents . This signal is only valid for 2 days.
Give me some energy !!
✨We spend hours finding potential opportunities and writing useful ideas, we would be happy if you support us.
Best regards CobraVanguard.💚
_ _ _ _ __ _ _ _ _ _ _ _ _ _ _ _ _ _ _ _ _ _ _ _ _ _ _ _ _ _ _ _
✅Thank you, and for more ideas, hit ❤️Like❤️ and 🌟Follow🌟!
❗Disclaimer
⚠️Things can change...
The markets are always changing and even with all these signals, the market changes tend to be strong and fast!!

SANDUSDT BULISHI have been watching SANDUSDT for a few days, and it has shown some different movements. Right now, I can see a bullish wave forming. Please check the targets on the chart, and as always, pay attention to the danger zone and stop loss. If the close crosses these levels, they will be activated.
Note: My ideas are not intended for any type of scalping or scalpers!
You can find the full list of my ideas here: www.tradingview.com
Here are some of my ideas:
