Formation of the next bullish waveBuying pressure on SANDBOX increased again after going through a corrective trend, and buyer support led to the formation of the next bullish wave. The target that we considered in the previous analysis is seen, and the main target is in the range of $1.02. Of course, due to the high strength of yesterday's bullish candle, which is closed at the ceiling, there is also a possibility of breaking this resistance. Its strongest resistance is considered in the range of 1.42 to 1.49 dollars.
SANDUSDT.P trade ideas

The Sandbox #SANDWhat Is The Sandbox (SAND)?
Launched in 2011 by Pixowl, The Sandbox is a blockchain-based virtual world allowing users to create, build, buy and sell digital assets in the form of a game. By combining the powers of decentralized autonomous organizations (DAO) and non-fungible tokens (NFTs), the Sandbox creates a decentralized platform for a thriving gaming community.
According to the official whitepaper, the Sandbox platform’s main mission is to introduce blockchain technology in mainstream gaming successfully. The platform focuses on facilitating a creative “play-to-earn” model, which allows users to be both creators and gamers simultaneously. The Sandbox employs the powers of blockchain technology by introducing the SAND utility token, which facilitates transactions on the platform.

Sandusdt Formed Bulish FlagFormed Bulish Flag In h4 Timeframe
Incase Of breakout expecting 25 To 30% bulish Move

Sandbox Testing TrendlineIn Daily Timeframe Testing More Then Year Old trendline Incase Of breakout expecting 140 to 150% Bulish Move
Entry Would Be Only Valid After breakout

✴️ The Sandbox | Major Bullish (Name Your Altcoin #19 ✅)The Sandbox just went through a major bullish development on yesterday's session.
For the first time since April 2022, SANDUSDT is now trading above MA200.
For the first time since July 2021 this event happens going north (up).
This is supported by a high volume day and strong RSI, signaling that this move is the real deal.
The Sandbox is now set to grow long-term.
After EMA300 is conquered as resistance, the long-term potential is confirmed.
I added some targets for your convenience on the chart.
120% first and up to 250% with more long-term for sure.
Namaste.

SAND Token 1 Day ChartSAND Token
The SAND token is the native cryptocurrency of the Sandbox universe. It is an ERC20 token and can be used to purchase in-game items, as well as to stake in the governance and rewards system. The SAND token will be used to power the decentralized economy within the Sandbox game, allowing players to purchase in-game items, pay for services, and participate in the governance and rewards system. It is also used to reward players for participating in the community and engaging in activities within the game. The SAND token will be available for purchase on the Ethereum blockchain.

SAND Coin (Sandbox) : "Buy the dip" with a nice TargetHi everyone!
Sand's main trend is still bearish, but we do not rule out some interesting corrective moves in the near term. If our analysis is correct, it might be interesting to accumulate on corrective swing and let Long positions run up to 0.6765 area.
If this idea will be supported by your "Likes" we will continue to follow the crypto with updates below.
thanks for your attention and please... trade with care! 💖

SANDUSDT needs to reload the long positionsSANDUSDT is currently trading near the monthly level at 0.81$, with the market forming a descending channel between the resistance and the 0.5 Fibonacci level.
The price is being closely monitored and it is expected to bounce from the 0.61$ area where the market could attract new liquidity.
On the left we can see how the price had a breakout from the falling wedge exactly on the weekly support
A falling wedge is a chart pattern that occurs in a downward trending market and is characterized by a series of lower highs and lower lows that are converging towards a common point.
This creates a wedge-like shape on the chart that slopes downward.
A clear breakout from the falling wedge typically indicates a reversal of the downward trend and a potential increase in price.

SANDUSDT future for 5%/50% Absolute X3My recommended trades are based only on the uptrend of the market. It will be opened in the time frame of 1 hour and at the end of the day, profit trading will be closed with any amount of profit. And only losing trades will remain open until they are liquidated. This trading strategy is backtested and works only in an uptrend.


Bullish pennant confirmedBullish pennant has been confirmed in 4h time frame
Expecting 200% bullish raise in case of breakout.
Keep ur eyes on it👀
Thank u for supporting us with ur like and comment
Good luck💙

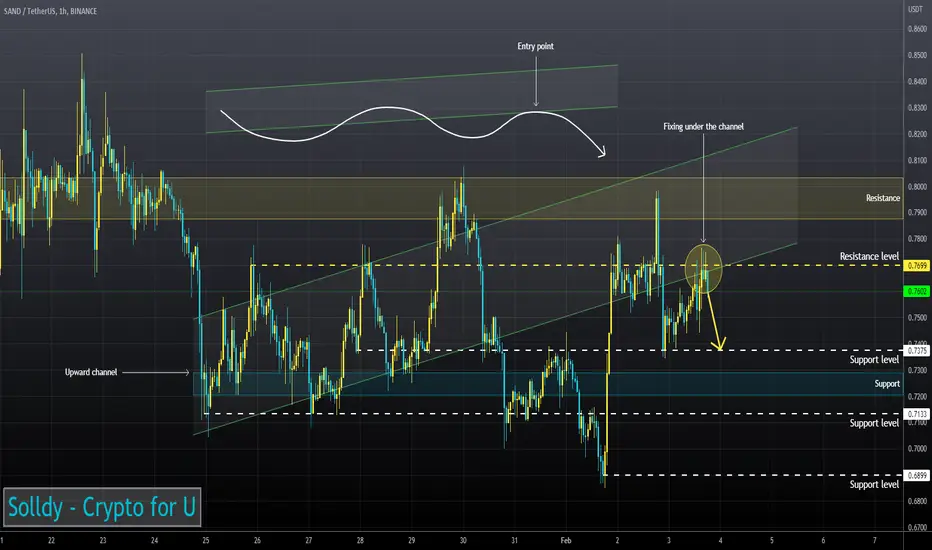
SANDUSD ❕ fixing under a channelSAND rebounded from the resistance area.
The price has fixed under the lower boundary of the channel.
I think the asset will continue to fall.
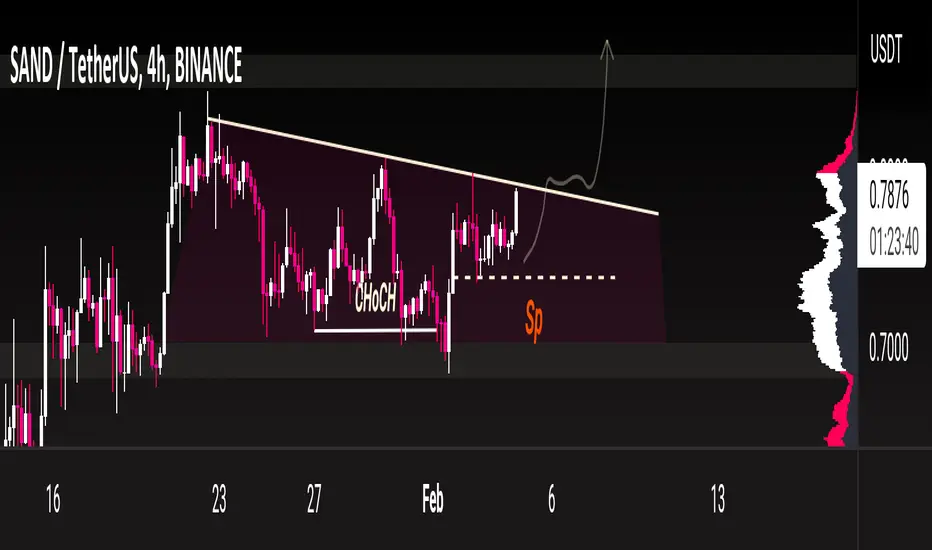
Lower bottoms and floors are being formedIn the 4-hour timeframe, the trend is in the range, but because lower bottoms and floors are being formed, there is a possibility of a deep pullback and testing the support of the 0.60 range.

SAND/USDT Sweet drop or Massive pump?Hey Traders!
SAND/USDT is next coin on our watchlist. We would like to see that ema100 to be broken in order to enter with a nice short position here. BB and RSI seem to be ready for a turnover so today will be the day where we see - if we secure that resistance zone or not. What do you think?
If you like ideas provided by our team you can show us your support by liking and commenting.
Yours Sincerely,
Swallow Team 🔱
Disclamer:
We are not financial advisors. The content that we share on this website are for educational purposes and are our own personal opinions.


SANDSalaam
Sand Broke the long-term descending channel.
It also broke the ascending channel (bear flag) that move on it for the last 2 weeks.
It seems to retest the broken levels.
If could close a 4h candle above the broken line, the trade will be violated.
Good luck,
Manage the risk!

Sand/usdt short setupSand / usdt make a short setup for now, we can entry in short position by 5× leverage!
If and only if BTC rise here , our setup can be failed but I think market is bearish now...

SAND analysis...check ithello guys...
sand breaks up its descending parallel channel very well and strongly!
in my opinion, it will touch the next line of the channel.
it is great if it pullback to the breaking line but if not be aware of the next movement!
there are two targets for spot assets, I show those as a pink area!
always do your own research.
If you have any questions, you can write them in the comments below, and I will answer them.
And please don't forget to support this idea with your likes and comments.


SAND Short IntraHTF Pull back Bias
Confluences:
15m Bos
Possible H&S Pattern
Pivot line as Entry Price
Target Profit:
0.5 supremacy

SAND / USDT Trading Idea Hello, traders
The trend is bullish and the momentum is still there, so we expect the bullish trend to continue
