SAND Impulse Move Begins; Profit Targets Up to 2300%🔹 After the completion of the correction phase, SAND has started an impulse move and is entering a strong upward trend. This shift signals significant growth potential in the near future. The price is breaking through key resistances, indicating a high likelihood of further gains.
🎯 First Target: $2
If the upward trend continues, SAND could reach the $2 level, offering a potential 500% profit from current prices.
🎯 Second Target: $10
With continued momentum, the next target could be $10, which would result in a 2300% profit.
💡 This analysis presents an exciting long-term opportunity for investors, potentially leading to substantial profits. While the trend looks promising, market conditions will play a key role in its continuation.
SANDUSDT.P trade ideas

#SAND: Unlocking the Metaverse EconomyDescription:
This trading idea focuses on SAND, the native cryptocurrency of The Sandbox, a leading blockchain-based virtual world platform. SAND plays a vital role in powering the metaverse economy by enabling users to create, own, and monetize virtual assets and experiences. With a growing user base, strategic partnerships, and increasing interest in metaverse projects from both individuals and institutions, SAND is positioned as a key asset in the expanding virtual economy. The Sandbox’s unique ecosystem, combining gaming, NFTs, and user-generated content, continues to attract attention, offering long-term potential for growth.
Nonetheless, it’s important to recognize that the cryptocurrency market is highly volatile, with prices influenced by factors like market sentiment, technological developments, and regulatory changes. Investing in SAND or similar digital assets requires a clear understanding of the risks and a disciplined approach to risk management.
Disclaimer:
This trading idea is for educational purposes only and should not be considered financial advice. Trading cryptocurrencies like SAND involves substantial risk, including the potential loss of your entire investment. Always conduct thorough research, assess your financial position, and consult with a financial advisor before making any investment decisions. Past performance is not indicative of future results.

Sandusdt So historically after btc pumps then alts pump next I think this coin setup looks good . Gona be buying small positions on coins that have a good set up and accumulation . Macd looks bullish . Alt season should start soon

#SAND/USDT#SAND
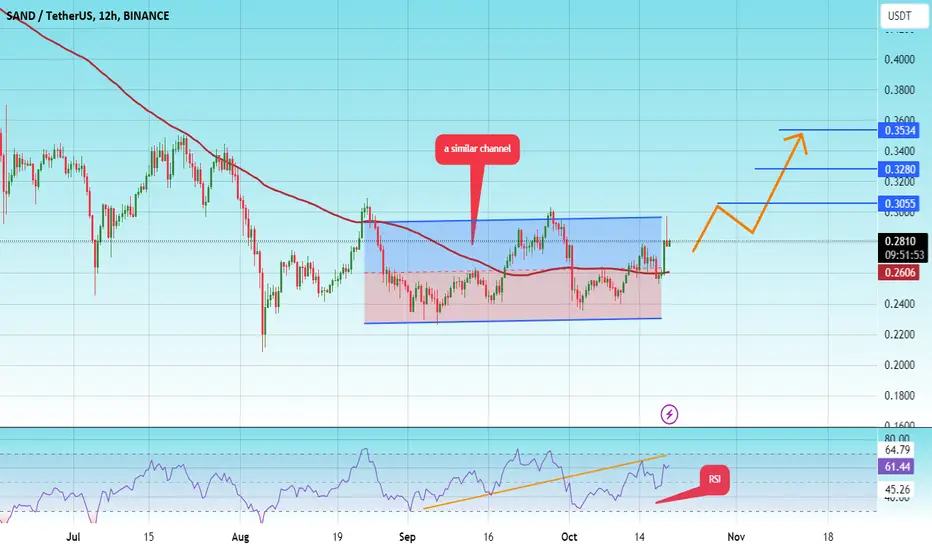
The price is moving in a similar channel on the 12-hour frame upwards and is expected to continue.
We have a trend to stabilize above the moving average 100 again.
We have an upward trend on the RSI indicator that supports the rise by breaking it upwards.
We have a support area at the lower limit of the channel at a price of 0.2380.
Entry price 0.2800.
First target 0.3055.
Second target 0.3280.
Third target 0.3533
SAND ANALYSIS (update)🔮 #SAND Analysis - Update 🚀🚀
💲 As we said earlier #SAND performed the same & 78% Profit booked so far. Now we can see that there is a breakout of the pattern in #SAND. But there is an instant resistance zone. After breakout above the resistance zone, we would see a new higher price in #SAND
💸Current Price -- $0.3629
📈Target Price -- $0.4702
⁉️ What to do?
- We have marked crucial levels in the chart . We can trade according to the chart and make some profits. 🚀💸
#SAND #Cryptocurrency #Breakout #DYOR

SANDUSDT 1WSAND ~ 1W
#SAND So far continuing to maintain this support Block,. If you still have Conviction on this coin,. Buy in increments on this support block, with a minimum target of 20%++

The Sandbox, Sand, Golden pocket sets up 100x Algo targetGolden pocket special...
I like sand, and when the narrative comes back around, this is one of the metaverse leaders...
to avoid being repetitive & to save time I'll just give the trade and spare you the write up. See linked BTC chart for more details.
The Trade:
Preferred Entry: $0.26 or 0.618 retrace of this impulse wave (if we get one) - best place to enter. allows for tight stops.
Ape Entry: $0.31
Stop: $0.25
Target: $32
D.Y.O.R. DO NOT BLINDLY TAKE THESE TRADES.
Never Trust. Verify. PLEASE DO YOUR OWN ANALYSIS.
This is not financial advice. These are just my observations.
Technical Analysis is not about being right, it's about increasing your odds.
Be prepared to be wrong. Risk management is key. Capital preservation above all else.

Time to play with the SANDBOXThe crypto boom has just begun and with BTC making new ATHs i have decided to start sharing some of my personal crypto plays for this cycle. SAND and long with MANA are my metaverse crypto plays that ill be covering during this crypto cycle, have been holding these for a while and think its time for them to bounce back. I have outlined some of my targets but depending on how hot things get we may see a lot more 👀
Added to my position today, best of luck!

SANDUSD_1D_Buyhello
Analysis of the SANDUSD symbol from the cryptocurrency market
We are a market buyer, maintaining the important support number of 0.2500
and Siusod at the price of 0.6000
140% growth rate

Trade Signal: SANDUSDT Potential Buy OpportunityHello Traders,
We have identified a promising trade setup for the SANDUSDT pair using the EASY Quantum Ai strategy. Here are the details of the potential trade:
Direction: Buy
Enter Price: 0.2777
Take Profit: 0.28376667
Stop Loss: 0.27136667
Analysis and Justification:
Our prediction for a bullish movement in the SANDUSDT pair is based on a combination of technical factors identified by the EASY Quantum Ai strategy. Here's why we are optimistic:
1. Trend Analysis: Current market conditions indicate a bullish trend with consistent higher lows on the price chart.
2. Momentum Indicators: Key indicators such as RSI and MACD are showing positive momentum, suggesting potential upward movement.
3. Support and Resistance Levels: The enter price of 0.2777 is near a significant support level, providing a solid base for upward movement.
4. Volume Patterns: There is an increase in buying volume, supporting the possibility of a price increase.
We recommend keeping an eye on the specified levels and adjusting your strategy as per your risk tolerance.
Happy Trading!

SANDUSDTSAND ~ 1W
#SAND If you still have Conviction on this coin,. This support block would be a very good buy for now.

The Sandbox | SAND The price of The Sandbox is $0.60 today with a 24hour trading volume of 244 million dollars. This represents a 6% price increase in the last 24 hours and a 11% price increase in the past 7 days.
but what is Sand? well Sandbox is a decentralized community owned virtual world. Creators can host custom games and events on the virtual world. Analysts like to compare Sandbox with Roblox due to their similarity in concepts. However the key difference with Sandbox is that players have true ownership of the virtual world assets in the form of NFTs. By doing so, LAND owners can host contests and events, stake SAND to earn and customize assets, monetize assets and experiences, vote in the metaverse governance, play games.
Saudi Arabia partners with The Sandbox for future metaverse plans.this year is an important year for crypto AR/VR projects and today many of them will pump thanks to Apple WWDC
next targets for sand are 0.63 , 0.65 and 0.69 $

60% for SAND soonPure TA and PA, for more information let me know please. This is bullish structure. GL
NOT A FINANCIAL ADVICE + MANAGE YOUR RISK AND USE STOPLOSS

SAND to 0.44Looks like a compression pattern. Just bougt it with stop below the last low. Lets see how it plays out.

SANDUSDT Risky Long ScalpI'm not feeling too good about this market right now so just been doing some quick scalp trades.
I like the setup for SAND here though based on the 15 min chart.
Entry: 0.2482
SL: 0.2463
TP1: 0.2514
TP2: 0.2564
This is a risky trade which is why I'm keeping my SL very tight.
We can try again if the price retests the 15 min key level. SL should be even better then.
Good luck and happy trading.

#sand loading.. If market reclaims, sand is waiting just below resistance area for increase continuation. Based on scorehood scores increase continuation on the way.

sand is ready to shorttttt booomthis chart is very good
and is ready to crash
so check this chart and hopeful
and follow meeeeeeee

Sandusdt trading opportunitySANDUSDT has achieved a significant milestone by reaching the $8.45 level, which currently stands as its all-time high (ATH). This follow with a substantial correction, with the price plummeting to $0.2763. Our analysis suggests that this price point may serve as the provisional bottom for the current market cycle.
In addition to our findings, we have been monitoring a trendline that has historically acted as a dynamic resistance throughout the correction phase. Notably, this trendline has recently failed to suppress upward price movement, with SANDUSDT breaking out above it. The price has stabilized, indicating a potential shift in market sentiment.
We anticipate a retracement back to this now-supportive trendline, which we consider an opportune moment for long position accumulation with stop loss just below the $0.2763 level to mitigate potential losses should the market take an unexpected downturn. The specific price targets for taking profits were provided on our chart.
We value your interaction with our analysis. Please support our work by liking this post and share your perspectives in the comments section.
Thank you for your engagement.

SANDUSDTSAND ~ 1W
#SAND We think this key support will start to be retested. If this support block is strong enough to hold the price,. then the price will bounce off this support block.
We will update if plans change to this Chart.

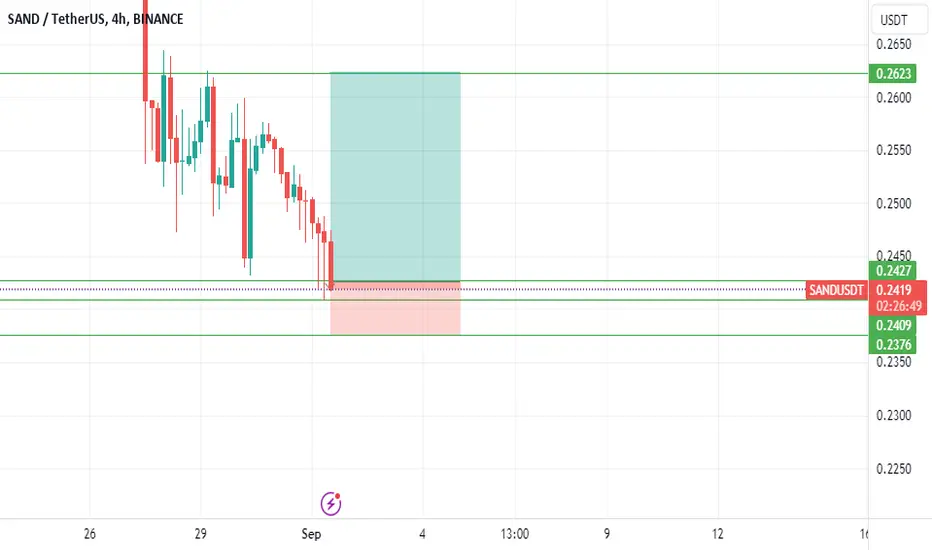
Trading and analysis in 4 hoursThere is a possibility of higher prices for the market
Below are the tips
Please if you use this position
Observe capital management
thanks
entry:(0.2431_0.2410)
st:0.2375
tp:0.2623

SAND ANALYSIS (breakout trading)🔮 #SAND Analysis - Breakout 🚀🚀
💲💲 In daily timeframe, falling wedge breakout is rone✅
Ready for a breakout in #SAND but right now we can see that #SAND is trading in its crucial resistance zone and if #SAND breaks the resistance zone then we would see a bullish move 💯🚀
💸Current Price -- $0.2929
📈Target Price -- $0.4700
⁉️ What to do?
- We have marked crucial levels in the chart . We can trade according to the chart and make some profits. 🚀💸
#SAND #Cryptocurrency #Breakout #DYOR

SAND Sell signalWe have bearish outlook on SAND H1 chart. Strong daily zone, H1 candle confirmed that bears are stronger. Risk reward 1:2
