SANDUSDT trade ideas

SAND USDT Technical AnalysisPrevious trend running was bullish
there was a divergence spotted previously and chart broke last HL and trend was changed to bearish, lastly there is a trend continuation pattern of bearish falling wedge and it also gave a breakout down , lastly there is no divergence at the moment so market is most likely to continue in bearish pattern , the trade was started at breakout of falling wedge

sand → you can hold it on 0.37$hello guys...
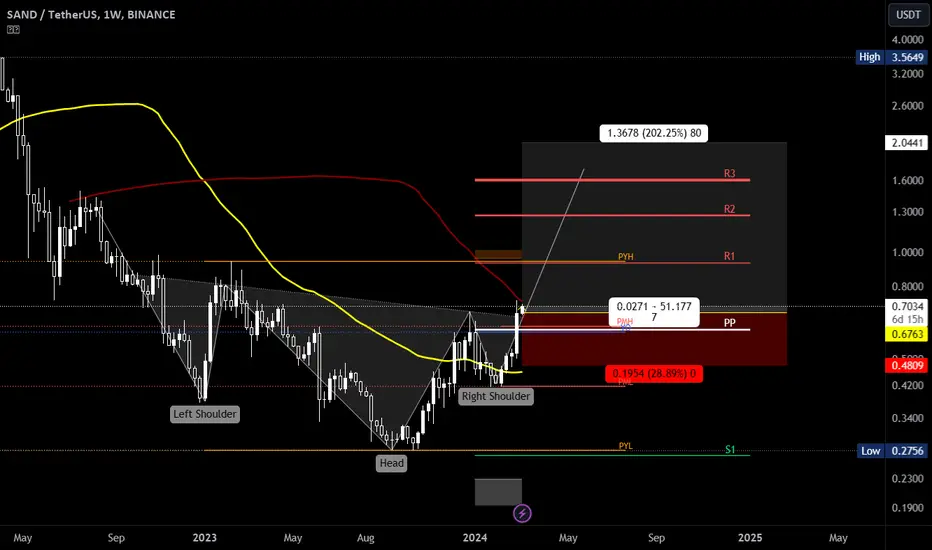
as you can see this coin broke up the descending channel and made a head and shoulders pattern on the breaking area!
so we can expect the price is going to touch the 0.37 area as a pattern's target and then it will start an upward movement toward 0.74$ and 0.99$!
______________________
always do your research.
If you have any questions, you can write them in the comments below, and I will answer them.
And please don't forget to support this idea with your likes and comment

#SANDUSDT#SANDUSDT
NYSE:SAND
Some pull back will resume our buy, will be expecting to join the buy from the POI below
#forex #forextrading #forexsignals #crypto #forexlifestyle #money #lifestyle #trade #stock #cash #iphone #daytrading #currencytrading #tradingonline #swingtrading #profit #forextips

SAND ANALYSIS🔮 #SAND Analysis : Pattern Formation 💰💰
📊📊 #SAND was making perfect and huge rounding bottom pattern and also breakout the neckline in 12h time frame, indicating a potential bullish move. If #SAND sustain above the neckline then we will get a bullish move📈📈
🔖 Current Price: $0.6536
⏳ Target Price: $0.8491
⁉️ What to do?
- We have marked crucial levels in the chart . We can trade according to the chart and make some profits. 🚀💸
#SAND #Cryptocurrency #Pump #Breakout #DYOR

✴️ The Sandbox 666.66% Potential | Consider This...This would be one of those pairs "already moving"...
We like to buy at the bottom or very close to support in order to ride the entire wave to the upside. Actually, we like to spot the reversal, get the bottom because there is lower risk.
For example, here SANDUSDT would need to drop 36% to test its last low; Corrections and retraces can show up out of nowhere and these are normally important levels. Buying from mid-September through mid-October would always be the best and most desired option... A bottom catch we call it but we cannot always get the best entry as the market continues to evolve everyday.
Let's continue... The Sandbox on the weekly timeframe.
And so we consider the longer timeframe, weekly and the full potential of this bullish wave.
We can see in a flash that SANDUSDT can produce a bullish wave of 666% within months.
Knowing this, the bigger picture, shows us that prices are still pretty low.
Those who started last month get a better entry but there is still plenty of time to play.
The market will continue to fluctuate and its conditions will change.
Sometimes we get full certainty, as before a major breakout and that's when we have tons and tons of leveraged trades, with high potential targets.
When certainty goes lower, our leverage also goes lower and also the amount of trades we share.
It won't always be a sure hit or a sure win, but opportunities will always be made available nonetheless.
When in doubt stay out.
When in doubt zoom out.
When in doubt sit down, breathe deeply and consider your choices before you make your next move.
You can even go out for a walk, take care of some business and when you get back the answer to your questions/doubts should be clear.
If doubt still lingers around after lots of thinking, plenty of thought, you can ask the opinion of others or you can just simply move on.
If you make a mistake, take the loss and move on.
If you make the right move, secure profits and rejoice.
No need to win them all.
No need to always trade.
Each time you win or lose, learn to take a break.
Namaste.

SANDUSDTThe signal was much earlier. As a result of the signal, the price rose by 94% and then corrected. But the targets remained, all targets based on Fibonacci levels. Long-term signal, purchases only on SPOT

SANDUSDT 12HRounding Bottom formation on the #SAND 12H chart, which is bullish for me. I'm buying some #SAND here. Expecting a 50% upward movement from here. Targets are:
$0.6872
$0.7992
$0.9417

🏖️💰 SAND/USDT - Range Entry and Profit Strategy! 📊🚀📈 Entry Options:
Retest of Lower Range Support: Look for an entry at $0.51, targeting a potential bounce off the lower range support level.
Break and Retest of $0.55: Consider an entry if there's a breakout and subsequent retest of the $0.55 top of the range support.
🎯 Profit Strategy:
Profit Areas: Plan to take profits at the next resistance zones, either $0.60 - $0.63 or $0.68 - $0.715.
⚖️ Risk Management - Stop Loss:
Entry at $0.51: Set a stop loss just below $0.47.
Entry at $0.55: Place a stop loss just below $0.52.

SAND NEW ACTIVE VOLUMESAND seems to enter a new volume trend in the coming time frames.
We will follow up to see if it's able to get new confirmations.
Sand is one of the coins below the range, that have high possibilities for price action return.

Is the fall of the digital currency Sand near?
By examining the trend in the one-hour time frame, the SAND cryptocurrency has hit the resistance of the ceiling of the ascending channel in the range of $0.55, and if it is maintained, there is a possibility of the price falling to the support of the floor of the ascending channel in the range of $0.50, in the meantime, Support will be seen at $0.52.

SAND uptrendHello guys,
I think the downtrend has come to an end and Sand will start an uptrend so as you can see I opened a trade for 3% risk and 9% profit

SAND/USDT Success Break the resistance, Bullish Momentum !!💎 SAND has recently demonstrated significant market dynamics. After successfully breaking out and reclaiming the price above the resistance area, SAND is now consolidating around the support area.
💎 There's a probability that the price will resume its upward movement and retest the strong resistance area.
💎 However, if SAND retraces back to the support and breaks below this level, it could signify a false breakout, leading to a downward movement towards the Bullish OB area.
💎 SAND must bounce from the Bullish OB area and reclaim the price above the support to sustain the upward movement. Failure to do so may result in further downward movement for SAND.

#SAND #SANDUSD #SANDUSDT #Short #ShortSetup #Eddy#SAND #SANDUSD #SANDUSDT #Short #ShortSetup #Eddy
Its my "ARB/USDT" short setup <3
Enjoy Guys ;-)
(("All the relevant areas and explanations on the chart are clear and clear, the trading setups need to get confirmation to enter, if you don't know how to get a trigger and confirm entering into transactions, this analysis is not suitable for you, the above analysis is for professionals. and if you are a beginner, my suggestion is that you don't destroy your capital and first learn technical analysis and basic trading along with psychology and risk and capital management from reputable sources and courses, and then enter the financial markets."))
(("The above analysis and setups and points and areas are combined with most of the combined styles such as price action, supply and demand, RTM, ICT and also with the analysis of important indicators such as Dominance Tether and Bitcoin.
If you are familiar with the mentioned styles and know how to get approval to enter the above styles, use the above analysis.
This is not an investment proposal and only my opinion, please act based on your experience and decisions."))
Related Bitcoin Analysis : (( BTC/USD )) : Check Link :

SANDUSDT looks in bullish trendSANDUSDT looks in bullish trend and make higher high that's why there is high chance to get in bullish trend that's why i am taking long entry here.
What do you think?

#SAND/USDT #SAND
The price is moving in a descending triangle on the 4-hour frame
We are now at the lower border of the channel from which the price has rebounded more than once, and this is also the support area
A rebound is expected to the upside
We also have support from the RSI indicator
Current price is 0.4300
First target 0.4400
Second target 0.04535
Third goal 0.4673

SAND/USDTIt is relevant... Acquiring SAND. A valuable asset in the portfolio. Awaiting targets to be met.
The Sandbox is a platform built on the Ethereum blockchain, allowing users to buy, sell, trade, and own digital assets in a virtual world. Assets are bought and sold as NFT tokens and can represent land plots, cars, artworks, and other properties.
- Not financial advice, trade with caution.
✅ Stay updated on market news and developments that may influence the price of TheSandbox. Positive or negative news can significantly impact the cryptocurrency's value.
✅ Exercise patience and discipline when executing your trading plan. Avoid making impulsive decisions driven by emotions, and adhere to your strategy even during periods of market volatility.
✅ Remember that trading always involves risk, and there are no guarantees of profit. Conduct thorough research, analyze market conditions, and be prepared for various scenarios. Trade only with funds you can afford to lose and avoid excessive risk-taking.
#Crypto #TheSandbox #Investment #SAND

#SAND/USDT is at do and die zone in 4-Hour TF!#SAND/USDT is at do and die zone in 4-Hour TF!
I am expecting a bounce from here. I will wait for bullish momentum to long it Or if it breaks the PML $0.4175 support level, I will short it.
SANDNYSE:SAND is moving in a favorable direction after breaking out of the trendline. After confirmation of the breakout, a suitable entry opportunity can be taken, with a reminder to always use a stop-loss for managing risks.

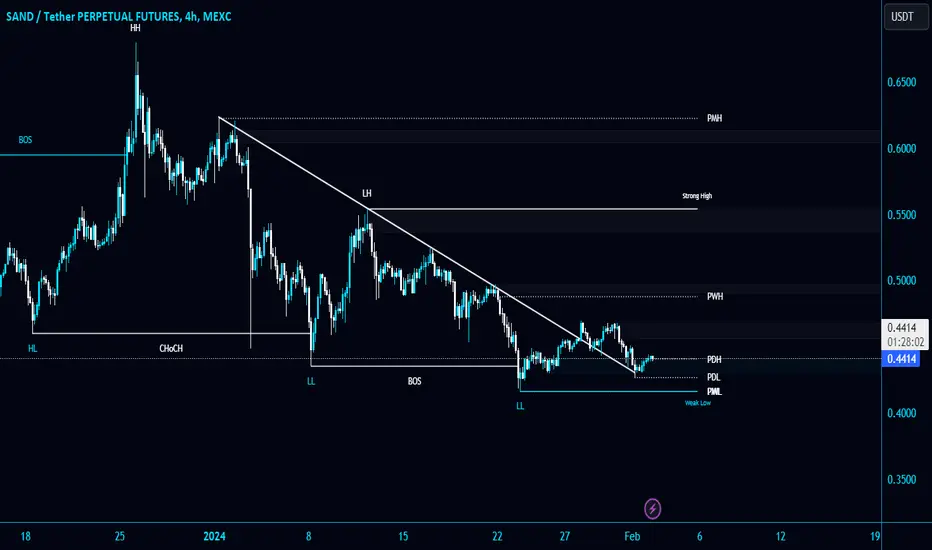
#SAND/USDT breaks the Diagonal Trendline in 4-Hour TF!#SAND/USDT breaks the Diagonal Trendline in 4-Hour TF!
NYSE:SAND retesting the Diagonal trendline. In case of successful retest, we can expect some bullish momentum in #SAND. The strong support level is PWL $0.416.


sand usdt video analysisi tried to keep it simple and i may have done a terrible job at that so I do apologize. There's still some good information in this video that can help you if your new to trading in general
good luck
Rigo
