SAND - Trade setupHey Guys,
Update on Market
No one knows what's going to happen. Trading is all about being able to read between the numbers, it's an art which empowers us to be able to make decision upon understanding the market. This world works on patterns, everything you come across will have a pattern, they say world is full of randomness, yes it is until we actually figure it out, the one who make good decisions are the one's who observe first. Try to understand what's going on in the market and take action accordingly.
Today Trade Setup
Falling wedge pattern, Sand had been trading in this pattern from past 5 days, In technical study of the market falling wedge concludes only one thing - "The trend is weak" therefore it's been moving with the decreasing volume or relatively low volume which results in trend reversal soon. Now we are at that phase where upward breakout is likely in favour, until and unless any external factor effects the market sentiment. So this is my trade setup for SAND against USDT, once i got breakout confirmation I'll dive into the market. Plan your trade accordingly.
Disclaimer : Make note that anything provided here is not a financial advice, trade accordingly.
SANDUSDT trade ideas

SAND/USDTCurrently, SAND is possibly at the stage of distribution where I am expecting when the 4H candles closed below the NPOC which is the green line, which confluence with the trend line support, once two of them are breached by the price action, I am expecting a mean reversion to the down side for them. The risk:reward over here is pretty decent and a lot of unsweep lows at the bottom. Peace

Sandbox Hello Traders,
Sand is trading in a triangle after 90 days of accumulation.
This is a strong bullish signal.
Stay tuned , first target on the chart.

SANDBINANCE:SANDUSDT
I'm looking for 100% gain from this areas before Christmas. Hope it pops up by today or tomorrow. If it takes more time without breaking out of this zone, I would cut this trade.

SANDUSDT▶️SANDUSDT
❇️Buy 1.16
❇️Buy 1.08
📈Targets📈
🎯TP1 : 1.44
🎯TP2 : 1.70
🎯TP3 : 1.95
🎯TP4 : 2.45
🛑 STOP LOSSE 🛑
6H Candle closing under 0.96

SANDBOX- Updated ChartMy updated SANDBOX Chart shows support at 1,31
Most likely i forsee a rise to 1.36 or even 1.43 targets.
Major News:
Sandbox voxel game and game engine Minetest 5.6.0 is out now
Version 5.6.0 brings with it:
More work on their rendering engine
Dynamic shadows
Fixed Transparency Sorting
Better mod support
Improved login/register UI
Improvements to the Scripting API
Minetest has been gaining some traction lately too, with more people taking notice like popular YouTuber AntVenom who did a video highlighting it that's worth a look
One Love,
The FXPROFESSOR

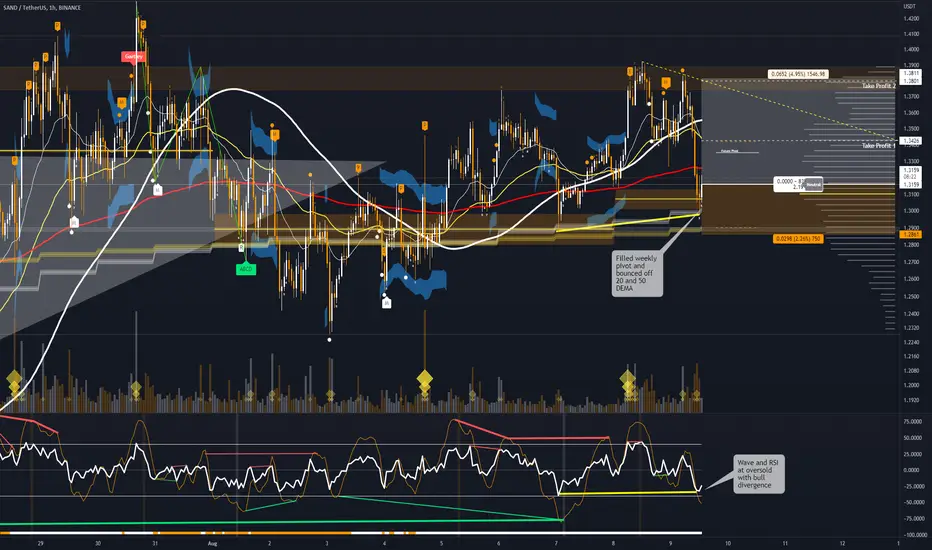
🎲 #SANDPERP #LONG #SCALP #IDEA 🎲🎲 #SANDPERP #LONG #SCALP #IDEA 🎲
Risk
- High
Entry Conditions:
- Bounced off 20 & 50 DEMA
- Filled Weekly Pivot and bounceing
- RSI and Wave going oversold
- RSI Bull DIvergence in play
News Source:
- n/a
Entry: $1.3159
Take Profit 1: $1.3430
Take Profit 2: $1.3811
Stop-Loss: $1.3811
SANDUSDT wants the breakout?The price is inside a descending channel on the 4h timeframe after the market bounced on the dynamic support on the daily one.
Not the price is testing an important resistance on the 1.4$ area.
How to approach it?
IF the price is going to have a breakout from the resistance and retest it as new support, According to Plancton's strategy , we can set a nice order
–––––
Keep in mind.
🟣 Purple structure -> Monthly structure.
🔴 Red structure -> Weekly structure.
🔵 Blue structure -> Daily structure.
🟡 Yellow structure -> 4h structure.
–––––
Follow the Shrimp 🦐

SAND, about to go out of the triangle area.The following content is machine translation:
The 1-hour chart is currently running in the triangle area, and the shock is narrowed, and it is about to break through the triangle area to choose a direction.
The indicator macd is currently in a bullish trend, the energy column diverges. The RSI indicator is holding steady above the neutral 50, operating within a bullish range.
Summary: Combining the current indicators and patterns, it is possible to break above and below. The triangle area is bullish and the short-term target is near 1.5. Under the short-term bearish, the target is around 1.25.

SANDUSD Hello Traders,
After 88 days in accumulation phase forming a triangle SAND seems ready to breakout.
Confirmation on 4H chart.

SAND good probability that we may see explosion to over $2If we can go climb over $1.5 and some change its a good probability that $2.00 can trade as their is almost no trades on this transit area.
Then slow grind back down to liquidity area of around $0.50 or lower.

Fake Breakout 1.You can diagnosis fake break outs with RSI divergence 2.One of good setups is wedge setup. Don't forget you can open position on third touch to trend line when you have divergence in RSI 3.Trend is your friend until it don't finish but here I didn't open position because I didn't have good r\r

SANDUSDT Breakout could be very profitableHey Traders, Hope your'e well. Sand has spent several months in an accumulation range. Within the range we have seen a deviation through support and back above. We have confluence with trendline support below price action supporting the move. It still needs to break out above the sloping trendline. Im watching it on the daily and H4 charts. Dont jump in to trade too early and make sure you use good trade management. gl

#SANDUSDT CUP & HANDLE PATTERN#SANDUSDT ANALYSIS
We can see Cup & handle pattern and still in the accumulation range.
symmetrical triangle breakout, you can build your position here or after breakout/retest resistance.

Gann setupwhen third Gann line break we can open short and you can set your targets on other supports or distance of TR

SAND (buy after breakout)SAND / USDT
The longer the accumulation the stronger the breakout !!
We can see Cup&handle pattern inside horizontal accumulation range
Best approach here is buying after breakout/retest above resistance area
Best of wishes

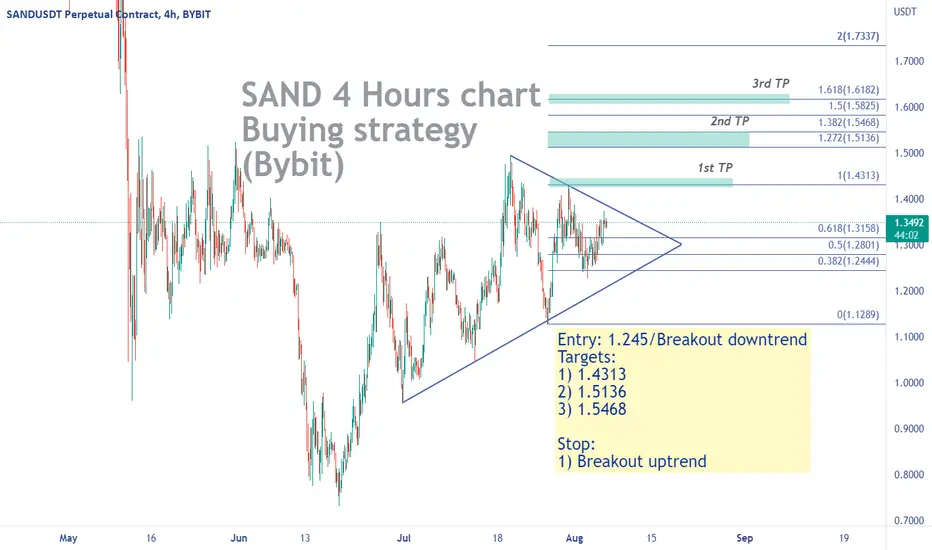
SAND - Buying signalBYBIT:SANDUSDT
4 Hours chart
-
SAND is consolidating with lower highs and higher lows in a triangle.
Currently it is approaching to the downtrend again, we can open partial position at 1.315, 1.245 or wait for breakout.
If it can take out the downtrend line and close above it, targets as below.
-
Targets:
1) 1.4313
2) 1.5136
3) 1.5468
Stop:
1) Breakout uptrend

✅TS ❕ SANDUSD: resistance✅✅SAND has reached the resistance level. The price was already falling below the level. I'm expecting a bounce down.✅
🚀 SELL scenario: short to 1.1482.🚀
----------------------------------------------------------------------------
Remember, there is no place for luck in trading - only strategy!
Thanks for the likes and comments.

SAND/USDT Possible scenariosHey guys
We see a possible scenarios for the SAND. We see nice formation forming where it is a good time to make some mid-term trades once we breakout. Also the market is oversold which gives us a hint about a big movement soon but before the movement we might see some corrections on the market or how we like to call them "Liquidation hunts".
If you like ideas provided by our team you can show us your support by liking and commenting.
Yours Sincerely,
Swallow Team 🔱
Disclamer:
We are not financial advisors. The content that we share on this website are for educational purposes and are our own personal opinions.


SANDUSDT ! The breakdown of the upward channel. Going down?🙈SANUSDT is trading in a wide range between 1.5300 (strong limit zone) and support 0.7480.
On the chart I noted an uptrending price channel, which the price is breaking down and on the retest will confirm the break. A consolidation in the short zone is forming.
At the moment, the crypto market continues to decline and I assume that SANDUSDT may go down behind the market.
I assume the final formation of a breakdown of 1.2792 level, fixation of the price under the level and a fall. The short-term target is the support at 1.1293, the medium-term target is the support at 1.0492.
Regards R.Linda!

SANDBOX - Market Feels Like Sand at this stage againGreek song for everyone:
'It's bad to build palaces on (with) sand'
Lyrics:
Everything that starts nice ends in pain
Broken hearts know that well
It is bad to build palaces in the sand
The tide will make it pieces
We start life with a thousand dreams
They are broken by pain and jealousy
It is bad to build palaces in the sand
The tide will make it pieces
We both bitterly cry our misfortune
The lost love, our gone first joy
It is bad to build palaces in the sand
The tide will make it pieces
Technical Analysis:
Support lost and now resistance at 1.30$
Unlike yesterday the price seems unable to fight it's way back up.
A test of 1.17 support should be in place.
In the meantime the markets could turn Red again on raised geopolitical concerns as well as fears about the global economic slowdown.
Take it easy today, we are choosing some extra shorts positions this week.
One Love,
the FXPROFESSOR
