sand idea"🌟 Welcome to Golden Candle! 🌟
We're a team of 📈 passionate traders 📉 who love sharing our 🔍 technical analysis insights 🔎 with the TradingView community. 🌎
Our goal is to provide 💡 valuable perspectives 💡 on market trends and patterns, but 🚫 please note that our analyses are not intended as buy or sell recommendations. 🚫
Instead, they reflect our own 💭 personal attitudes and thoughts. 💭
Follow along and 📚 learn 📚 from our analyses! 📊💡"
SANDUST trade ideas

My Analysis on SANDUSDTWe Already have a complete impulsive move UP, Now SANDUSDT is looking to complete the correction move with A, B formed and C, forming. We also have a clear head and should pattern to support this and also Bitcoin which looks to breakout of a rising wedge to the downside. check out my analysis on BTCUSDT

SANDUSDT - LONG BEFORE CPI NEWSHello guys,
It's been a while i didn't post an idea on crypto-currencies.
Today we'll take a look on SANDUSDT, which i think has some probabilities to pump within next days.
The price hit the 0.50 fibonacci level and start to reject the uptrend line at 0.69$.
I'm considering opening a trade from this area to 0.90$.
Take profit and stop-loss are directly on the graph.
Trade safely.


SAND to finish (B) wave in the correctionAfter the last impulse wave (1), SAND in the correction. T?he last price action formed (b) wave in the correction wave. If the wave doesn't extend to be impulse wave, the price will visit 0.9 area before going back for (c) wave of the correction and visit 0.6 area.
This could be changed if the price moved below 0.7 from here.

SAND/USDT Price Prediction - 1WTrend Prediction - SAND/USDT Forecasting -
Resistance and Support Lines
Falling Wedge Pattern
**** Yousef Sharafi ****
Follow me here for more analysis
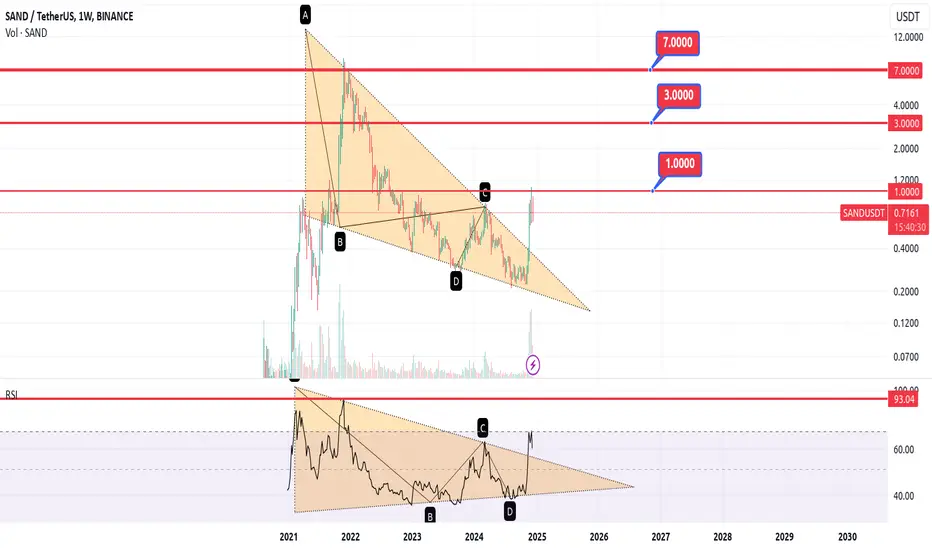
SAND(TheSANDBOX) - Resistance levels at weekly chartKey levels of SAND/USDT, where the price may face difficulties to break at first touch/reach, throughout this bullrun.
x.com/Sezmoon96

SANDUSDTAfter the descending channel breaks at the end of the big wave 2, I expect growth to the specified area in the long term.

SAND's Liquidity Phase📊 SAND appears to be consolidating and gathering liquidity.
✅ If it maintains support near $0.73, a potential upward move toward $0.80 and beyond could be in sight.
👉🏼 Current behavior aligns with accumulation before a directional breakout.
👉🏼 The next moves are aligned with the chart's structure.

sandusdt idea"🌟 Welcome to Golden Candle! 🌟
We're a team of 📈 passionate traders 📉 who love sharing our 🔍 technical analysis insights 🔎 with the TradingView community. 🌎
Our goal is to provide 💡 valuable perspectives 💡 on market trends and patterns, but 🚫 please note that our analyses are not intended as buy or sell recommendations. 🚫
Instead, they reflect our own 💭 personal attitudes and thoughts. 💭
Follow along and 📚 learn 📚 from our analyses! 📊💡"

SAND NEXT TARGET ??
#SAND is exhibiting a strong bullish reversal pattern, with a potential for a 120% profit target at $1.7038 The price has recently broken out of a descending trend line and is currently consolidating. A retracement into the Fibonacci area around $0.6643 could provide an ideal entry point for buyers.
The $0.6643 level aligns with the 0.618 Fibonacci retracement, making it a critical zone for potential correction and accumulation.
Look to buy near $0.6643 during a correction phase for optimal risk-to-reward

SAND can go up to (+270%)Sand is looking very good , strong momentum and can get another 270% increase. With huge bullish divergences in the higher timeframes and moneyflow increasing and above anchored vwap from 2022 highs with weekly candle close above $0,82 would indicate a continuation. The target is between $2,44 to $3,38 with fibonacci levels, point of control and value area low from 2021/2022 highs, a possible 270% rise in its price.

$SAND/USDT Analysis NYSE:SAND is trading within an ascending channel with a strong support zone around $0.85-$0.87.
A breakout above the channel's midline suggests bullish momentum, targeting $1.11 +26% .

$SANDUSDT about to continue the bullish move to above $1This 2H chart of BINANCE:SANDUSDT highlights a retracement-based bullish setup. Following a recent breakout of the $0.71 resistance zone and a retracement back to the zone which aligns with the 0.618 Fibonacci retracement zone, a bullish move is expected as BINANCE:SANDUSDT would continue its bullish trend. Enter long positions near the current level. Watch for breakouts above $0.88 for confirmation of continued bullish momentum, then a push to $1 and finally $1.10
Parameters
Entry: Between 0.71 - 0.78
TP1: 0.85
TP2: 1.00
TP3: 1.10
SL: 0.64
This is a 1:5 RR Bullish setup.
Like and comment your thoughts about the setup.

SAND | Massive Volume IncreaseThe Sandbox chart looks beautiful. The volume increased massively, and the gaming sector in general is doing really well. I think this is ready for lift-off.

#SAND Bullish Cup with Handle📊#SAND Bullish Cup with Handle 📈
🧠From a structural point of view, we reached the staged resistance zone at the daily level and then fell back, which is very reasonable. However, the ideal target zone at the daily level has not been achieved, so it is still a bullish trend.
➡️In addition, a bullish cup with handle structure is also constructed on the 1h chart, so the probability of us continuing to rise from here is high. At present, we have locked in major profits and will expect more with the remaining positions.
🤜If you like my analysis, please like 💖and share it💬
💕 Follow me so you don't miss out on any signals and analyze 💯
BITGET:SANDUSDT.P

The Sandbox 1,111% Growth Potential (Accumulation Strategy)While we are going to be looking at the log. chart for The Sandbox, when we look at the linear chart we can simply say that this pair is trading at bottom prices.
A simple accumulation strategy is the best practice for pairs like this one.
With the log. chart (the main chart above) we can know exactly what has been happening, let's consider that one now for this analysis.
➖ The Sandbox vs Tether (SANDUSDT)
Let's start with growth potential. Long-term, we have a higher low.
SANDUSDT hit bottom in July 2021 and so far we have a higher low in August 2024.
This means that a long-term higher high, a new All-Time High is possible for this pair.
We are talking about a $22.22 target.
From current price, which is within the long-term accumulation range, that would amount to a total of 87X or 8,600% profits potential.
Easy target we have 415% mid-term and 1,111% which is the main target mapped on this chart; also mid-term.
In September/October 2023 most of the Altcoins hit a low and from this low a bullish wave followed; the recovery year we termed it. Many of these Altcoins are trading within higher lows this year but some, like this one, hit a lower low in August. This mid-term lower low is irrelevant when it comes to the bigger picture. The bigger picture is a major bull-market in 2025.
The lower low reveals lack of interest for this pair by the general public or the insiders not being interested in buying. Whatever the case, we can still expect massive growth in 2025 when everything will come to life.
2023 was not a bull-market year.
Some pairs, some projects did grow in bull-market like proportions but this wasn't a "full-blown bull-market." Such an event in this space happens once every four years. 2013, 2017, 2021, 2025, 2029... Any action in-between is part of the transition between bear and bull.
Get ready and prepare because we are only months away.
While it will take some time and at least until Q2 2025 until it becomes pretty obvious for the masses what is happening, we will see some action now, in 2024, followed by one final correction and then the positive craziness in 2025 will be upon us.
Prepare as best as you can.
Make an effort to be in the market early because this type of opportunity doesn't come often and can be life changing if approached in the right away.
Right now these are just words... But you will see, it will be something great and even hard to belief; but again, 100% positive.
Namaste.

For #SAND/USDT, I want to see a liquidity Sweep For #SAND/USDT, I want to see a liquidity Sweep and a tap on 4H FVG for a long position.
I'm not longing here. NYSE:SAND FVG is aligning with PMH's $0.08684 support level.

SAND/USDT 100% POSSIBLITY BREAKSAND/USDT Analysis: Potential Break Ahead
The SAND/USDT pair is showing an intriguing setup, which could be confirmed by a new break zone. We will closely monitor the market for any signs of confirmation regarding this coin's movement.
If this coin manages to rise from the current zone, it could initiate a new upward cycle.
The most promising scenario is a 100% increase which can go with time. However, it’s important to note that this may take time, as there are no guarantees in the crypto market. Additionally, much will depend on further data confirmations.
If SAND achieves a break soon the price could potentially target the $0.74–$0.82 range.
This coin has manny levels as open space which can have a break to old levels.

Here I buy The Sandbox at $0.90Buying The Sandbox at $0.90 right now
And The Sandbox supply shock is set at $0.90
All I ever wanted
All I ever needed
Is here in my aaaarms
Words and charts are very unnecessary
They can only do harm


SAND/USD Fibonacci targetsSand is currently at a main resistance. If it breaks we will continue to pump even harder.
The current chart shows the most important Fibonacci targets.
Grey: Resistance/support, decisive prices. A dump/pump can happen at these levels, but is not a main target
Red: Main target to take profits or potentially enter shorts
Green: Buy or rebounce expected
Red box: resitance are, mainly caused by the 1.618-1.65 fib level
Green box: Support level, mainly 0.618-0.65 fib
Breaking each target gets us to the next one.

SAND - Could Get To $83?Top game coin has been very strong and is already up x3 since our perfect $0.25 November entry.
But the question is; can it get to $83?
