Key data points
Previous close
—
Open
—
Day's range
—
About Satoshi all time history index
Satoshis, or sats, are the smallest unit of bitcoin (BTC), the world-famous peer-to-peer technology operating without any input from banks or government. 100,000,000 satoshis make up one bitcoin. Some people see sats as a useful way of addressing unit bias – where people prefer whole units over a fraction of a unit. As a full bitcoin is now considered too pricey for many retail investors to acquire – so the thinking goes – people may've become less inclined to trade it. Others on the Internet have voiced the opinion that working in sats makes 'bitcoin appear cheap', and will partially obscure the cryptocurrency's massive growth to date. Regardless of who's right, a bitcoin will always be a bitcoin. It'll always be 100 million satoshis too.
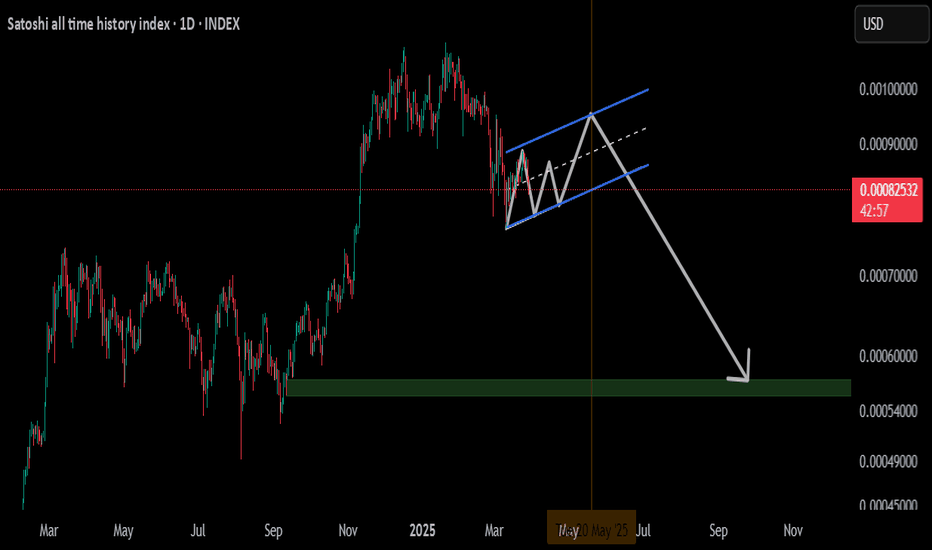
Price drop warning based on historical patternsSo we had a lot of similarities in the CRYPTOCAP:BTC bullish cycle with the previous cycles. I believe it is logical that we will have some similarities in the correction. So I checked based on the Ichimoku indicator and I imagine such a pattern for the future trend of Bitcoin. But this is just on
My idea about BTC!!!!!I think these lines have a magical quality, and the price respects them.
Considering the strong resistance at 108K and the robust trendline around the 67K to 70K range for Bitcoin, it seems likely to remain a range-bound zone. Given the time we have until late 2025 for a new high around 190K, this
Satoshi- Over time, everything diminishes, including opportunities.
- You won't achieve the same percentage gains as those who joined in 2011.
- However, when you calculate and compare these numbers with inflation, you'll find yourself consistently on the winning side.
- One day, people won’t measure va
BUY BTC, and BUY HARD!After breaking the resistance , don't think twice! #btc
✅✅⬆️⬆️ I will Just buy it! ⬆️⬆️✅✅
and the stop-loss will be the red trigger line.
In the case of failure to break it, the price might drop. so the sell trigger is the red line.
❌The charts reveal a volatile landscape. Recent price action
BTC Analysis: Downtrend Channel, Sharp Dip DROP Potential The price is currently trading within a descending channel.
A strong weekly resistance level lies ahead.
Increasing volume suggests buyers are waiting for lower prices to enter.
A sharp drop in price is a possible scenario.
Elaboration:
The current market situation presents a bearish outlook with t
See all ideas
Displays a symbol's price movements over previous years to identify recurring trends.


