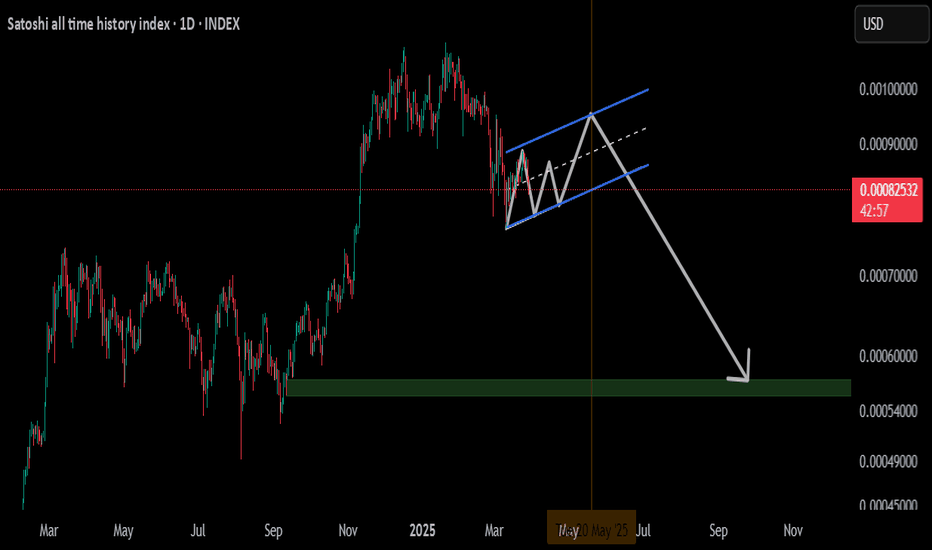
SATSUSD trade ideas
Price drop warning based on historical patternsSo we had a lot of similarities in the CRYPTOCAP:BTC bullish cycle with the previous cycles. I believe it is logical that we will have some similarities in the correction. So I checked based on the Ichimoku indicator and I imagine such a pattern for the future trend of Bitcoin. But this is just one of the possible scenarios. Don't always be bullish. The market has two sides. So always have short trades in your plan. Be with the trend. Be safe.
happy Eid Al-Fitr
My idea about BTC!!!!!I think these lines have a magical quality, and the price respects them.
Considering the strong resistance at 108K and the robust trendline around the 67K to 70K range for Bitcoin, it seems likely to remain a range-bound zone. Given the time we have until late 2025 for a new high around 190K, this is my mental roadmap:
We’ll experience fluctuations, possibly even a drop to the 70K range, followed by a target of $180K to $190K.
Best regards.
Satoshi- Over time, everything diminishes, including opportunities.
- You won't achieve the same percentage gains as those who joined in 2011.
- However, when you calculate and compare these numbers with inflation, you'll find yourself consistently on the winning side.
- One day, people won’t measure value in BTC anymore. They’ll measure it in Satoshis.
- It's still early, secure your financial freedom.
Happy Tr4Ding !
BUY BTC, and BUY HARD!After breaking the resistance , don't think twice! #btc
✅✅⬆️⬆️ I will Just buy it! ⬆️⬆️✅✅
and the stop-loss will be the red trigger line.
In the case of failure to break it, the price might drop. so the sell trigger is the red line.
❌The charts reveal a volatile landscape. Recent price action has left many investors feeling like they’re caught in a bull trap.
BTC has been consolidating since March, and sooner or later, it will transition into a distribution phase.📈
Pay attention to the red line—the sell trigger. If BTC fails to break resistance, a price drop could follow📉.
🔺On higher time frames, the RSI (Relative Strength Index) suggests an upcoming movement out of the oversold zone, potentially favoring the bullish scenario.
This analysis does not contain investment advice or recommendations. Every investment and trading move involves risk, and readers should conduct their own research when making a decision.
BTC Analysis: Downtrend Channel, Sharp Dip DROP Potential The price is currently trading within a descending channel.
A strong weekly resistance level lies ahead.
Increasing volume suggests buyers are waiting for lower prices to enter.
A sharp drop in price is a possible scenario.
Elaboration:
The current market situation presents a bearish outlook with the price confined within a descending channel. This pattern indicates a downward trend, suggesting that sellers are in control.
Moreover, the presence of a strong weekly resistance level ahead further reinforces the bearish sentiment. This resistance level acts as a barrier that the price has struggled to surpass in the past.
Interestingly, despite the bearish trend, there is an increase in trading volume. This could be interpreted in two ways:
Buyers' Accumulation: Buyers might be accumulating positions at lower prices, anticipating a potential reversal in the trend.
Increased Selling Pressure: The rising volume could also indicate increased selling pressure, pushing the price further down.
Given these factors, the possibility of a sharp downward movement, or a "sharp dip," cannot be ruled out. This sudden price drop could occur as buyers exhaust their strength and sellers regain control.
Considerations:
Market Sentiment: Pay close attention to overall market sentiment and news events that could influence price direction.
Technical Indicators: Utilize technical indicators like RSI and MACD to identify potential trend reversals or continuations.
Risk Management: Employ sound risk management strategies, including setting stop-loss orders and positioning sizing appropriately.
This analysis is for educational purposes only and should not be construed as financial advice. Always conduct your own research and employ sound risk management practices before trading.
IF DROPS: pay attention to the SELL trigger line and the first target might be the bottom of the channel. it will be also the breaking of the accumulation zone too which means strong momentum is needed in the market.
IF RISES: pay attention to the BUY trigger and break out of the channel too and it could still the force of the weekly resistance and nearing the HALVING time too.
BTCAfter the ABC wave until the end of 2022, the price is 15,000. At the end of wave 3, the price was 12,000. With the beginning of 2023, the price grew and moved more than expected. Right now, we are facing two scenarios, a big upside to the neck line of 48,000. Or a smaller shoulder server in the weekly time with a neck line of 25,000. Everything is visible in the picture.
BTC ThoughtsWe are roughly 247 days from the next Bitcoin Halving. Historically price has always increased up until and 1 year after this date. This is easily one the best trades to be making. It really doesn't matter where you get in, as long as you are getting in! However, if you are looking for a targeted entry, you can try grabbing it around $26000. I'm anticipating possibly a move up, followed by a larger correction down to 26k area. Set your buy limits accordingly.
And yes I understand, "everyone" expects Bitcoin to bull run on the halving. Anything can happen, but do understand that it's a mathematical certainty that the supply of BTC will divide in half in under a year. So in this case, the crowd is probably correct. Don't let your doubts get in the way of a smart investment.


