SATSUSDT LONG SCALP 07/09/2025Caught the reclaim of VWAP with buyer delta stepping in volume confirmed, no hesitation.
We’re above the 1h FVG midpoint, so I’m not fading—this isn’t the pullback, this is displacement.
Targeting the weak high at 1020 with liquidity stacked above—I'll exit partial there and watch for rejection to reverse.
If they nuke it before that I’m cutting below 1005—this trade willpay fast.
SATSUSDT trade ideas

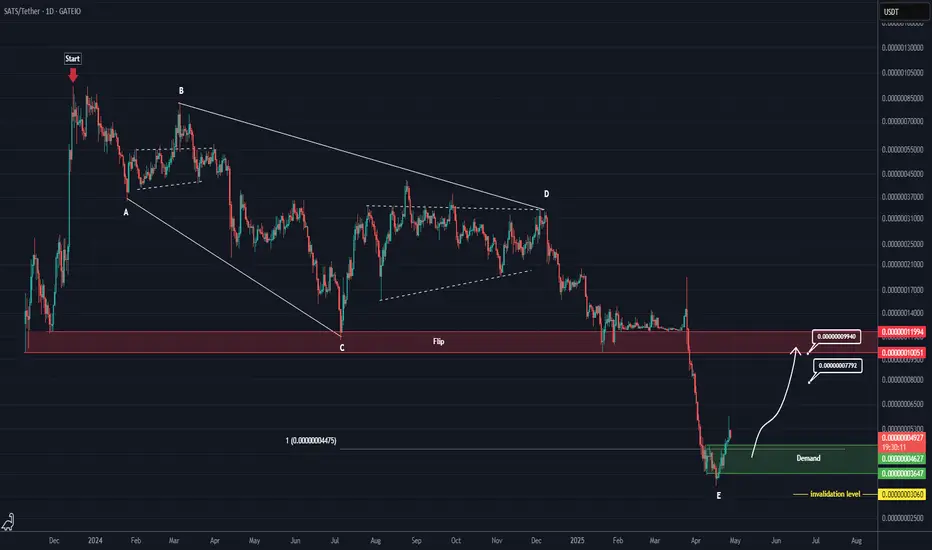
SATS has completed a corrective pattern (1D)Attention: This is a risky and highly volatile meme coin.
The correction of SATS started from the point where we placed the red arrow on the chart.
This correction appears to be an expanding triangle, as wave C is longer than wave A, and wave E is longer than wave C.
Currently, a support zone has formed below the price. As long as this area holds, the price can move toward the flip zone or near it.
Since the flip zone is fresh and untouched, the price may get rejected from this level.
The closure of a daily candle below the invalidation level would invalidate this analysis.
For risk management, please don't forget stop loss and capital management
When we reach the first target, save some profit and then change the stop to entry
Comment if you have any questions
Thank You
SATS FIFTH WAVES PASSEDSATS looks awesome. Fifth waves passed. And now only bull trend. Even it’s meme. But still we have BTC season

SATSUSDT LONGSATS took Liquidity from previous daily swing low and went into consolidation for weeks…
It’s currently showing signs of a Bullish move, after grabbing liquidity and Changing character… we could see a potential Buy pressure for a short while, and for SATS to flip completely Bullish, it has to break a major resistance zone

1000SatsAs you can see, we have a psychological level of around 0.00010 people buying well. This trade is based on phycology, and we have one bearish pattern called double top on the weekly time frame for those who took our last trade to enjoy your profits, you can short again but this time it is risky so be ready for anything and don't lose that you gain


1000Satswe need liquidity, so here is the short-side trade with very low risk. I hope you guys like that


SATSUSDT 4DSATS ~ 4D
#SATS This trade is high risk. But if you still have Conviction on this coin,. This is the last support block on this coin. Buy in stages with a minimum target of 20%+

SATSUSDT 4DSATS ~ 4D
#SATS This trade is very high risk. But if you still have Conviction on the coin,. This support block would be a very good buying place for now,,. with a short term target of at least 20%+

$SATS: Strategic Entry into Emerging BRC-20 TokenSATS (Ordinals) ( NASDAQ:SATS ): Strategic Entry into Emerging BRC-20 Token
SATS (Ordinals) (SATS) is a crypto in the CRYPTO market. The price is 3.09154e-07 USD currently with a change of -0.00000 (-0.03748%) from the previous close. The intraday high is 3.25692e-07 USD and the intraday low is 3.0072e-07 USD.
Trade Setup:
- Entry Price: $0.000003093
- Stop-Loss: $0.0000001528
- Take-Profit Targets:
- TP1: $0.0000004644
- TP2: $0.0000007421
Fundamental Analysis:
SATS (Ordinals) is a BRC-20 token representing the smallest unit of Bitcoin, known as a satoshi. With a capped supply of 2.1 quadrillion tokens, it symbolizes a fractional ownership of Bitcoin's value. The token has garnered attention following its listing on major exchanges like OKX and Binance, leading to significant price movements. (tradingview.com)
Technical Analysis:
- Current Price: $0.0000003091
- Moving Averages:
- 50-Day SMA: $0.0000002800
- 200-Day SMA: $0.0000002500
- Relative Strength Index (RSI): Currently at 60, indicating neutral momentum.
- Support and Resistance Levels:
- Support: $0.0000002800
- Resistance: $0.0000003500
Market Sentiment:
The recent listings on prominent exchanges have amplified interest in NASDAQ:SATS , resulting in increased trading volumes and heightened volatility. The token's association with Bitcoin's fundamental unit appeals to investors seeking exposure to Bitcoin's value in a fractionalized form. (tradingview.com)
Risk Management:
Setting a stop-loss at $0.0000001528 helps limit potential downside, while the take-profit targets at $0.0000004644 and $0.0000007421 offer attractive risk-reward ratios. Given the token's volatility, strict adherence to these levels is essential.
When the Market’s Call, We Stand Tall. Bull or Bear, Just Ride the Wave!
Disclaimer: This analysis is for informational purposes only and does not constitute financial advice. Traders should conduct their own due diligence before making investment decisions.

1000Sats/Usdt Breakout And Retest Done1000SATS/USDT has already broken out of a major trendline and completed a successful retest, confirming its strength. This setup indicates a strong bullish momentum building up, and I’m expecting a potential rally of 40-80% in the coming days, assuming market conditions remain favorable.
Key observations:
- The breakout was clean, followed by a retest that turned previous resistance into support. This is a classic technical confirmation.
- Volume during the breakout suggests significant buyer interest, a positive sign for continued upward movement.
- The chart structure is showing a transition to an uptrend, with higher highs and higher lows forming.
Things to watch for:
- Resistance levels may cause minor pauses, but if cleared, the price could move swiftly upward.
- Keep an eye on the volume; rising volume will confirm the bullish strength.
Trading strategy:
- If entering now, watch for any pullback to the support zone for a better risk-reward ratio. The current zone may not last long as the trend develops.
- Short-term traders can target quick profits at nearby resistances, while long-term holders might benefit from holding through the larger trend.
Risk management:
- Place stop-losses just below the retest level to minimize risk in case of unexpected moves.
- Allocate only a portion of your portfolio that you’re comfortable risking, as this is still a volatile asset.
This trendline breakout and retest setup is a promising opportunity. Staying patient and managing your trade carefully could lead to rewarding gains.

SATS CryptoSATS crypto is currently riding a bullish wave, but a drop below the $0.0002900 support level could signal a shift to a bearish trend.

Sats and 1000Sats are in a head and shoulders pattern Sats and 1000Sats are in a head and shoulders pattern and their prices breaked the weekly trend

SATS Ordinals price is trying to rise, but for how long?After six months of a stable downward trend, the price of #SATS (#Ordinals) began to rise on increased trading volumes.
😱 Of course, six months to a year ago, holders were promised “golden mountains”, but in fact, after being "put in longs", there was almost a 10-fold depreciation of the asset.
🆗In the range of $0.00000045-0.00000060, there will be strong sales from those who want to get out of the drawdown at least to “zero”, this is how human psychology works.
And if you want to try your luck and trade OKX:SATSUSDT , then buying earlier than in the range of $0.00000017-0.00000022 can be harmful to your health and deposit) 🍿
_____________________
Did you like our analysis? Leave a comment, like, and follow to get more

SATS Is Ready to Crash from Here?There is a possibility that BYBIT:SATSUSDT may have a pullback from here.
Based on the price of the 4H timeframe, this may print.
If you don't have a good margin, use stop loss as required.
We can take advantage of the pullback by risking 2% of the account balance.
Manage your risk appropriately.
What are your thoughts about this analysis? Share them with me in the comment box.
If this analysis makes sense to you, support my idea and follow me now for more.

#SATS Possible Scenario#SATS Possible Scenario
Breakout of main trendline
Breakout of MA
Breakout of high volume
See you on the Moon

The SATS Price Plunged 15%, but Could Keep FallingThe SATS price plunged more than 15% in the past 24 hours to trade at $0.0000001474 at press time.
With this latest drop, the altcoin’s weekly and monthly performances have been forced deeper into the red.
The SATS price is approaching the critical support level at $0.0000001435. Should the crypto fall below this key price point, it could be at risk of plugging to the subsequent mark at $0.0000001265.
However, SATS remaining above $0.0000001435 for the next 12 hours could invalidate the bearish thesis. In this alternative scenario, the crypto might end up attempting a challenge at the $0.0000001665 resistance level. Overcoming this threshold could then give the crypto the foundation needed to keep climbing in the following 24 hours.
Technical indicators on the 4-hour chart for SATS warn that the crypto might not be through dropping just yet. Both the Moving Average Convergence Divergence (MACD) and the Relative Strength Index (RSI) indicators are showing bearish signs. These technical indicators are also on the verge of triggering major bearish flags.
Firstly, the MACD line is collapsing towards the MACD Signal line. Traders usually see this as an indication that a crypto is about to enter a negative short-term cycle. A confirmation of this might be if the MACD line crosses below the MACD Signal line.
Meanwhile, the RSI is on the cusp of breaking below its Simple Moving Average (SMA) line. This could indicate diminishing buyer strength. If bulls don’t step in soon, the RSI could soon fall below the SMA line to signal that sellers have gained an upper hand against buyers.
If these technical flags are confirmed and validated, the SATS price could soon lose the key support level at $0.0000001435.
Disclaimer: The information presented in this article is for informational and educational purposes only. The article does not constitute financial advice or advice of any kind. Ecoinimist is not responsible for any losses incurred as a result of the utilization of content, products, or services mentioned. Readers are advised to exercise caution before taking any action related to the company.

#SATS Rally Alert: : Buy Your Ticket to Success!**Technical Analysis Chart Description:**
Welcome to my Technical Analysis charts on TradingView! Before we dive into the analysis, it's essential to understand some important warnings:
1. **Subjectivity Alert:** Technical analysis involves interpreting market data and chart patterns, which can be subjective. Different analysts may interpret the same data differently, leading to varied conclusions.
2. **Historical Performance Doesn't Guarantee Future Results:** Past price movements do not guarantee future price movements. While historical data can provide insights, it's crucial to consider other factors that could influence price action.
3. **Risk of False Signals:** Technical indicators and chart patterns can produce false signals, leading to potential losses if relied upon blindly. Always cross-verify signals with other indicators or fundamental analysis.
4. **Market Volatility:** Crypto markets are highly volatile and can experience rapid price fluctuations. Be prepared for sudden and unexpected price movements, which may invalidate previously identified patterns.
5. **Risk Management:** Proper risk management is essential. Never invest more than you can afford to lose, and consider using stop-loss orders to mitigate potential losses.
6. **Emotional Bias:** Avoid emotional decision-making based on short-term price movements. Stick to your trading plan and strategy, and don't let fear or greed influence your decisions.
**Disclaimer for Crypto Trading:**
Trading cryptocurrencies carries inherent risks, and it's important to understand the following:
Cryptocurrency markets are highly speculative and can be subject to extreme volatility. Prices can fluctuate significantly within short periods, leading to substantial gains or losses.
Investing in cryptocurrencies involves the risk of total loss of capital. Unlike traditional assets, cryptocurrencies are not backed by any tangible assets or central authority, making them inherently risky.
Regulatory uncertainty and market manipulation are additional risks associated with cryptocurrency trading. Regulatory changes or negative news can have a significant impact on prices.
This analysis is for informational purposes only and should not be construed as financial advice. It's crucial to conduct thorough research and consult with a qualified financial advisor before making any investment decisions in the cryptocurrency markets.
By using this analysis, you acknowledge and accept the risks associated with cryptocurrency trading and agree to trade at your own discretion. The author of this analysis shall not be held responsible for any losses incurred as a result of using the information provided.

SATS NEW INCREASE VOLUMESATS seems to have a new increase view with the possibility that we are going to see a new volume trend in the coming time frames.
For confirmations, we need to follow the coming time frames.
This coin has seen since MAR month 3 breakdown trend.. the new time frames can make a change for a new uptrend since a long time ago.

SATS_Long_DailySATS is a BRC-20 token that pays homage to satoshi. SATS is the abbreviation for satoshi, the smallest unit of Bitcoin. One satoshi equals to 0.00000001 BTC. Please note that the token is a meme token and is inscribed by an anonymous team. 1000SATS is 1000 times of SATS.

SATSUSDT.PHello Trader OKX:SATSUSDT.P
good enough chart for consolidation of this pair market, can be long the range of entry area that I have determined.
SPOT ONLY, futures can use very small leverage because the stop loss is quite far away
entry area 0.0000002758 - 0.00000026577
take profit 35%
stop loss 7%
Please add a comment and Positive feedback and constructive criticism are important to authors and the community.
Disclamer: Not Financial Advice

Bullish ⬆️ SATS/USDTBullish ⬆️ SATS/USDT
Bullish ⬆️ SATS/USDT
Bullish ⬆️ SATS/USDT
Bullish ⬆️ SATS/USDT
