SC/BTC time line story ========== First Wave ==========
SC coin moves from 30St to 750St ATH about 2630% and gain 720St
then move down for a long correction from 760St to 45St about -94% and lose 710St
========== Second Wave ==========
moves from 50St to 450St about 595% and gain 385St
moves down for a correction wave from 440St to 114St about -75% and lose 335St
========== Third Wave ==========
moves from 110St to 320St about 172% and gain 210St
i think it will moves down for a correction wave from 320St to 110St about -65% and lose 210St
SCBTC trade ideas


Just a sia idea :)Cycle almost completed. Going to lock & load. New cycle Oct/Nov starting..
In case support line holds that could be earlier..


siacoincycles and targets are clear on chart.in this type of cycle i choose a short term target and long term downside and then another jump.
good luck and if this analyze deserve a like press that.


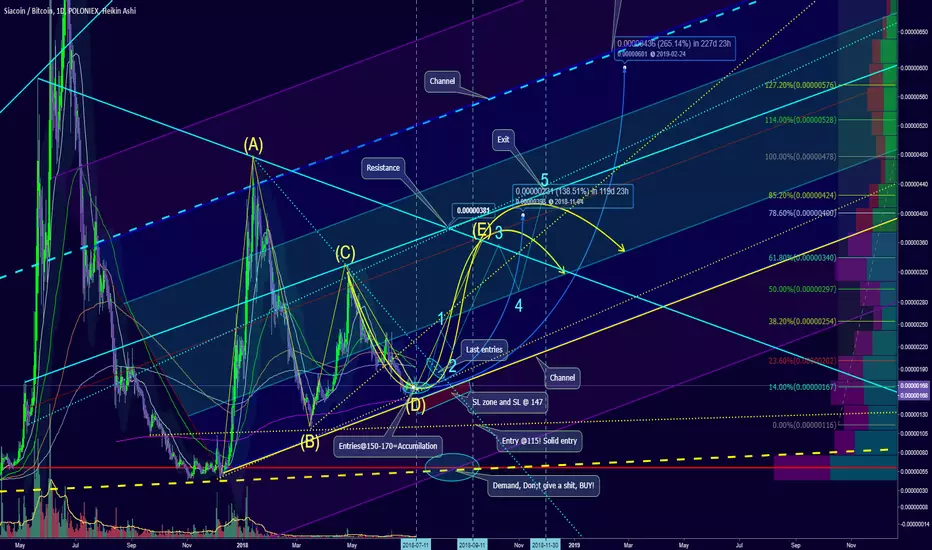
Bullish Path to 400 Satoshi or 130% - non Fractal Chart & clearA lean version of the original chart without fractal ripples.
This is a second attempt at the Sia Coin.
Last time, i had a few things wrong, for starters the A-E pattern was incorrect.
I was right about the SL, so that saved a few $$.
Now we are in even better position then the last time.
Entering now between 150-170 is where u want to be.
Stop loss anything below 147 :(
We should have a strong rally. Provided BTC 1.17% does not fuck this up.
July 11-15 should be a trend reversal and Accumulation zone.
Future:
Something will happen around September 11th, 2018!? Sia crash or boom? Breakout or Sell off.Corporate Merger/Partnership?
SIA is still one of the better coins to invest: Team, service, product and exposure, even in bear markets.
~Explore the chart for possible scenarios of price actions - use zoom and scroll for better view.~
/*This information is not a recommendation to buy or sell. It is to be used for educational purposes only.*/
If you want your coin to be analysed, please PM me.
Thank you,
Ajion
7/11 - Trend Reverse upto 100% gain: entries, exits and SL addedClean charts are included!
This is a second attempt at the Sia Coin.
Last time, i had a few things wrong, for starters the A-E pattern was incorrect.
I was right about the SL, so that saved a few $$.
Now we are in even better position then the last time.
Entering now between 150-170 is where u want to be.
Stop loss anything below 147 :(
We should have a strong rally. Provided BTC does not fuck this up.
July 11-15 should be a trend reversal and Accumulation zone.
Future:
Something will happen around September 11th, 2018!? Sia crash or boom? Breakout or Sell off.Corporate Merger/Partnership?
SIA is still one of the better coins to invest: Team, service, product and exposure, even in bear markets.
~Explore the chart for possible scenarios of price actions - use zoom and scroll for better view.~
/*This information is not a recommendation to buy or sell. It is to be used for educational purposes only.*/
If you want your coin to be analysed, please PM me.
Thank you,
Ajion

SCBTCThe formation of a downward wedge that will form at support level 78.6 on fibbonachi
Exiting this figure will test two levels of resistance 61.8 and 50.0
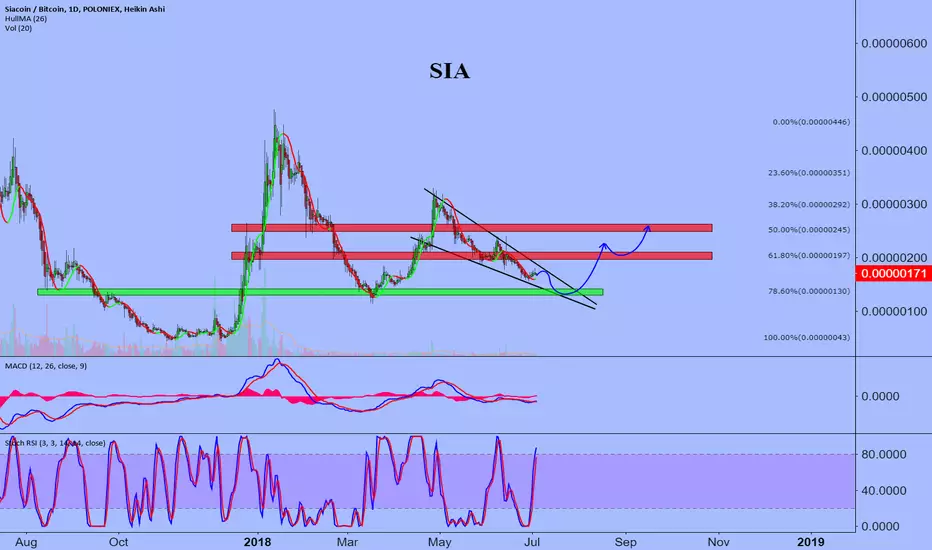
SC - Good signs - Midterm LongHey guys!
Several signs tell us that buying SC could be a great chance to grab some profit.
1. We broke out of a major downtrend on 28.06.
2. RSI break out of falling wedge
3. Forming and sucessfull tesing of 155 Support area (3 times)
My oppinion is, that we cant do a big mistake here. When we buy now, and set SL below our Support area, we got a nice RR.
My target will be between 188 and 222, most likely short below 200 as a natural resistance area and next to 50% fib area, but depending on the action within the next days.
So RR is >2. Let' hope the best.
Happy trading!
!! Mention: This is my personal opinion, no trading advice. Its your money, your trade, your risk and your responsibility


sc short term targettaget 1 is 221 if it breaks
target 2 is 250
taget 3 is 390
all are short term taget
low volume generate high price.


Butterfly Labs 2.0This has the potential to go to near 0. You can follow the progress of Siacoin on their websites and forums.
1. Split community/Miner wars
2. Upcoming legal battles
3. Competitors - Filecoin, Storj


Siacoin Breakout?Big Falling Wedge.... waiting for Beakout, I can see 500 sats and beyond.
Hyperspace Hard Fork.
Giving 10SC:1Hyperspace
To the moon

SCBTC Chart 23/06/2018Just keep an eye on The BTC chart. When it breaks the support line just wait for the next target. When it bounce buy it and be rich XD.
I would like to have comments


Looking at Siacoin Next Moves.Hey, I am back with another Technical Analysis, this time looking at Siacoin .
Siacoins project is about building cloud storage based on Siacoin currency which can be very cheap in comparison to other cloud storage providers.
Okay, so that was about Siacoin in short, lets just look at the chart.
You can see Siacoin have here many downtrend and uptrend lines.
There is also a overal downtrend and overal uptrend which are about to traverse.
What is important for Siacoin to be in uptrend and follow my drawn prediction?
Well Siacoin has to always find support at this overal uptrend, also RSI on daily cannot break below 40, or it may like to 38-36 but its needs to bounce immediately, currently in downtrend headed to retest 180 support and overal uptrend level, where it needs to bounce off to remain in overal uptrend.
Needs to break EMA and than 50MA , but that will happen in meantime, the thing to focus at now is that Siacoin needs to find support always at this overal uptrend .
RSI uptrend would be lovely.
So I think thats about it.. If you have any Questions feel free to ask me down bellow or at my Discord channel!
Hope I made your view on whats going on with Siacoin somewhat clearer.
If you like this Technical Analysis let me know in the comments, Likes are aprreciated, Thanks !
If this chart gets a bit of attention and I would see something worth to share on the chart I will surely do an Update .
