Siacoin SC Drop Before Next Run Up (HIGH RISK)Chart is self explanatory, enjoy!
Do not invest what you can't afford to lose. We are not your financial advisors.
If you're not a member yet, consider joining!
SCBTC trade ideas

SCBTCSC has already went above Trendline Resistance (B), which is a great sign of upwards momentum should be expected.
However, SC has to gain above the Trendline Resistance (A) + a price above 0.00000285 BTC needs to be met in order for a further uptrend to be determined.

Siacoin BTC PoloniexSiacoin is looking bad after breaking down past Trendline Support (B).
Will not see an improvement in price until it breaks above Trendline Resistance.

SC - SIACOIN WILL GO HIGHER IN A FEW DAYSIf BTC goes well and stabil , SC will make you happy. Dont sell it until 350. At 350 there is a ressitance if it breaks that, It could rise up more

Siacoin bigger picturethere's about 25-30 % gain during wave 3 of bigger picture. then about double this during 5th:)
Again it isn't any of financial advice - it's your money and you are responsible for it.
TIPjar BTC: 1kZcUJnJLc2W3BatdjCgiBojJKFK78Xtu


SC TIME For buyBuy zone 230-300
Sell zone - 620-960
Long sell - 2-5k
AFTER APRIL AND MAY NEED SELL FOR BTC OR ETH !

possible Cup&Handle on SiaCoin? Daily Graphic i can see a possible cup&handle in the graphic, what do u think?

SIA AT POLO- MAY TOUCH AS LOW AS 150 ,TO FINALLY KICK OFFPRICE IF FALLS FURTHER WILL GET SUPPORT AT 150 AT SMA 150 AND Fibonacci LEVEL OF 0.23 , WITH IN FEW DAYS , TO FINALLY TAKE OFF FOR ATH . FROM NOW ,BY MID MARCH IS THE TIME WHERE IT WILL GO MOON.

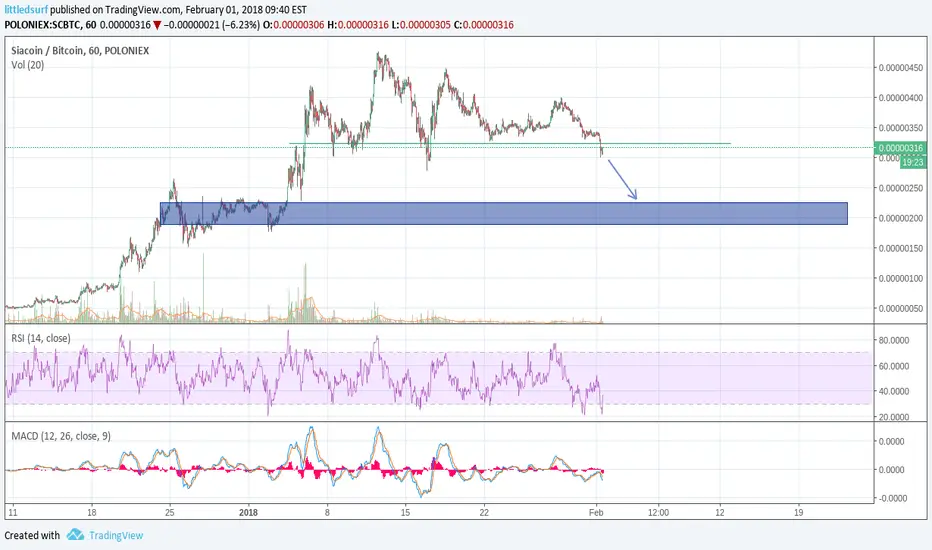
SIA broke support, looking to add to position
Broke support of .00000320, now looking to add to position @ entry points designated in highlighted box
SiaCoin SCBTC(Poloniex) Buy Opportunity 208% Profit PotentialI'm not good in the description
Buy in: 370-400
Targets:
1) 500
2) 600
3) 800
Stop loss: 350
Get into the Trade and Thanks me later :)

sc/btcSCBTC found good support on uptrendline! Also there is bullish crossover on MAs, so we can expect further
up to the 416 satoshi lvl. After that, if we break resistance we go to the local high of 477.
Volume is still low, trade with care

Bullish 22+% Possibility Waiting for the SC to break out of the short term downward trendline and keep following the long bullish trendline support levels. We see Fib retracement towards the 475 levels. Watching this one closely over the next 1-2 weeks.
----------------------------------------------------------------------------------------------------------------------------------------------------------------------
The information provided and accompanying material is for informational purposes only. It should not be considered legal or financial advice. You should consult with an attorney or other professional to determine what may be best for your individual needs.


SIA - buy on a breakout. looks like not really soonSIA - buy on a breakout. looks like not really soon

SIACOIN How to Tradewaiting broke downtrend line, you can buy in 400 point, we have support in 280 and resist in 475. this is impportant if broke the downtrend line better you try to long term, maybe price can hit 500 or more, not recommendation for sort or middle term.
good luck.


SC ready for breakoutWedge forming, just needs to break resistance.
Big things coming for SC in 2018. Long term pt $0.50 (imho)
