SCBTC trade ideas
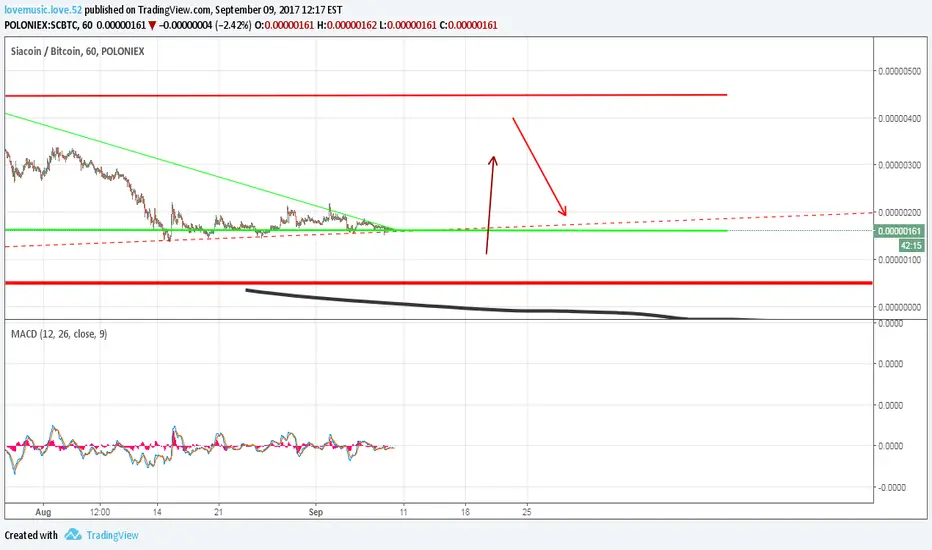
SCBTC is GOING UP SOONI see the opportunity to BUY SCBTC
It is going up for sure
it is failing many times in pushing lower
so now we can target at area of 0.00000122 with 85% confidence level
If you like my analysis please help to like and follow
Thank you


SIACOIN Perspective D1• Last D1 Support Zone held.
• One of best coin with cheap price for now. ( with highest price 751 - 830 )
• It's a Swing Trade, so I will just Buy and forget.
Have a great trade & Have a nice day,
Kindly follow our Instagram pages it's about daily psychology & developing the best mindset for traders.
@t r a d e r s m i n d .
@t r a d e r s m i n d .


Siacoin Long Term TradeThe price diverges with RSI at the support zone. It's the 1st signal which tells us about a possible trend reversal. We can expect that the market will bounce from the support zone and start a new uptrend. For investing and long term trading, we can use the daily chart for searching entry levels. The 1st buy order should be placed above the local high at 0.00000140 level. When the market passes throguh the cloud, it will be a confirmation of trend reversal and a new buy signal. Pending order will be placed above the high of the signal candle. Stop orders must be placed below the support zone at 0.00000090 level. Profit targets are 0.00000500 and 0.00000750 levels.

Potential Buy on retracementPotential buy on retracement at trend line / price level support marked on chart. waiting for Stoch RSI at over sold condition.

SC vs BTC I put chart before that the down trend will change soon ( you can back to it ) .
for short term we can buy sc from 111 or when time come at 23:00 mecca time zone ..
targets is 122 then 133 last 144
stop loss will be closing two bearish candles under 111 ..
good luck for all


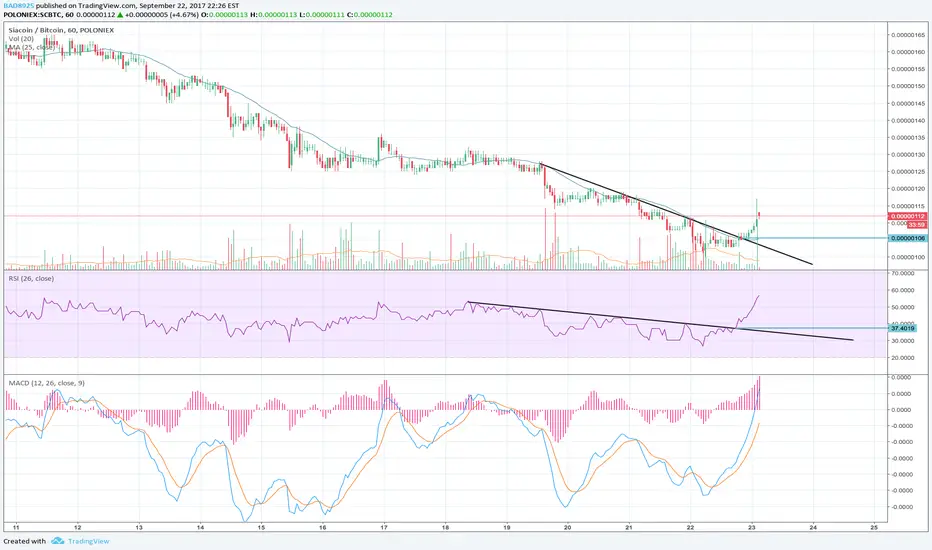
SCBTC just break downtrend so it is moving a bit up moreI see the opportunity to BUY SCBTC
for short term trade the target price will be around 0.00000136-0.00000140
it will retrace back a little bit
so you will buy at that point
If you like my analysis and signal
Please help to like and follow
Enjoy trading

Siacoin looks good all aroundDivergence on the USD chart.
Oversold on the BTC chart.
Looks like an all around good time to go long.


SCBTC turned to be garbage this weeki think I see the opportunity to SELL SCBTC
it is going DOWN as from my prediction probably 30% from what it is value now
so it is kind of garbage if you hold this investment
recommend to cut loss for whom bought or short sell now
If you like my analysis please help to like and follow
Thank you

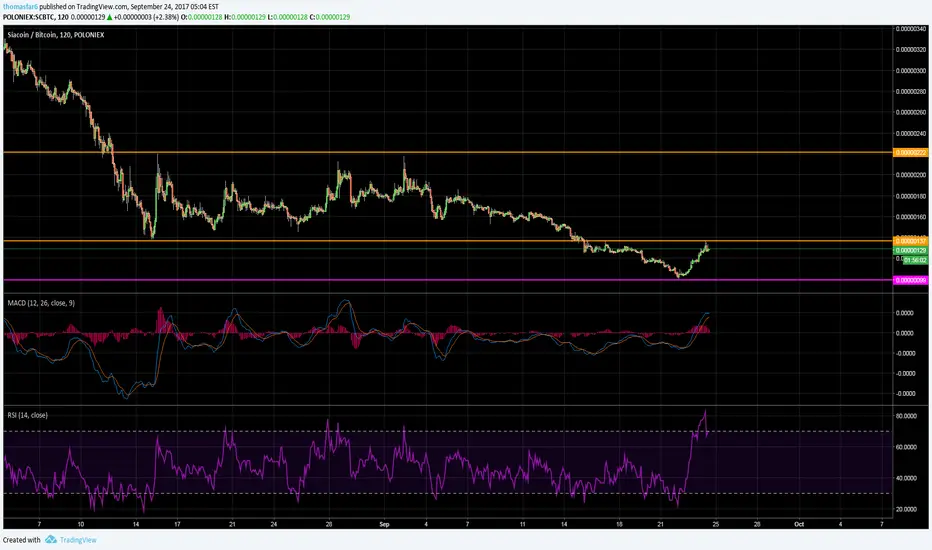
SIACOIN - Time to keep an eye out? Siacoin is holding at its price nicely in the market, it may be time for entry, however, watch out for a correction back to the support line before another increase. Trade the lines accordingly.
SC is it time?I've always like Siacoin, strong fundamentals, MACD shows us a clear buy simple (depicted by the green thumbs up on my chart). Additionally there's talk that there will be a news release sometime in October, maybe November that will act as a catalyst.
Trade at your own risk. Good luck.

Siacoin Double Bullish DivergenceDouble bullish divergence was formed by the price, RSI and MACD. We have a strong trend reversal signal. Also the market bounced from the support level. RSI confirmed price reversal. MACD supports upward movement. DMI allows open long trades. Pending orders for buy must be placed above SMA50 at 0.00000121 level. Stop orders must be at 0.00000098 level. Profit targets are 0.00000150 and 0.00000200 resistance levels.

SC/BTC LONGJust a quick TA of Siacoin. With crypto, it's so difficult to predict because the news articles influence the price so much. I think a good buy in point would be 106. I just sold at the peak at 117 and am hoping to accumulate more coins through this day trade.
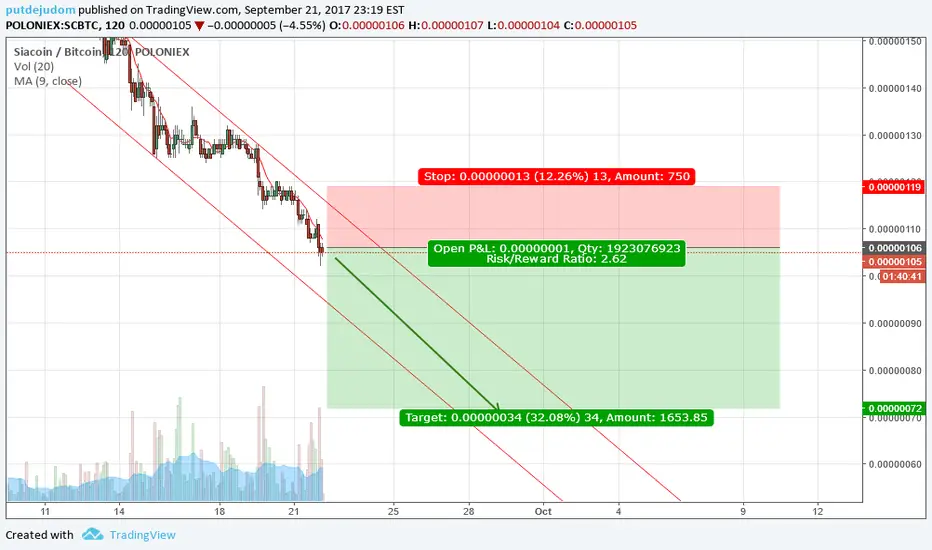
Trade Recommendation: SiacoinGuys, this is a new buy opportunity for Siacoin. On a 1h chart, you can see my entry, target and stop loss point. Good luck!

SC/BTC BULLISH WOLFEIf you think the bulls will beat, follow the green line. If it comes to good news, it will be above the green line. But if bad news, it is good to sell 0.00000080.
