SCBTC trade ideas

Siacoin uptrend confirmed !Downtrend line broken shortly after a W bottom has formed. Should test uptrend resistance level of 420sats.

Thoughts on SC in the ours before the Bitcoin Cash forkI think we could hit somewhere near the top of the bollinger bands and then fall back to escalating support. But at the end of the triangle who knows what might happen.
Looks like >270 sats is a good buy.

Fundamental over Technical - SC is a Sleeper I like to keep things simple and stupid, because you don't need to complicate things to see the big picture. When you keep big picture in mind and exercise patience it's much easier to profit in these unpredictable markets.
Couple of points:
- With initial negative Obelisk reaction, uncertainty over development funding and alt coin market crash, Sia got hit harder than most. I believe it has been over-sold.
- A bottom has been clearly established. Strong buy at the blue box area and I've been noticing multiple high-value bids around here (3-10 BTC worth) which looks like accumulation.
- $400K grant will cover full-time development of 4-5 devs for 1 year (less uncertainty).
- Obelisk under production, expect to hear updates and release date in a few months (less uncertainty).
- Recent bounty announcements for developers to build apps, Sia being positioned for some great growth in the months to come.
- Taek mentioned that they are in talks with Coinbase, Kraken, etc to add SC so it can be purchased directly purchased, he is confident this will happen within the next year.
- Still in super-early beta without proper UI polish or marketing, major releases (and more 'exciting' features like video streaming, file sharing) are yet to come.
I cannot predict the timeframe for when Sia will fully recover. With strong support in the 260-300 sat area, there is much more room on the upside than on the downside at the moment. Given the above points, and the fact that this coin already has a strong community, and devoted devs who know what they're doing, and a legitimate use case which is financially attractive for small businesses, and major upgrades from the road-map still yet to be released.. I think this coin is prime for a good long-term hold.


$SC Possible bullish run trend reversal - Long with confirmationWith bitcoin drama finally ending, SC may turn around and go for a bullish run, expecting a confirmation at 350, safe entry 275-300
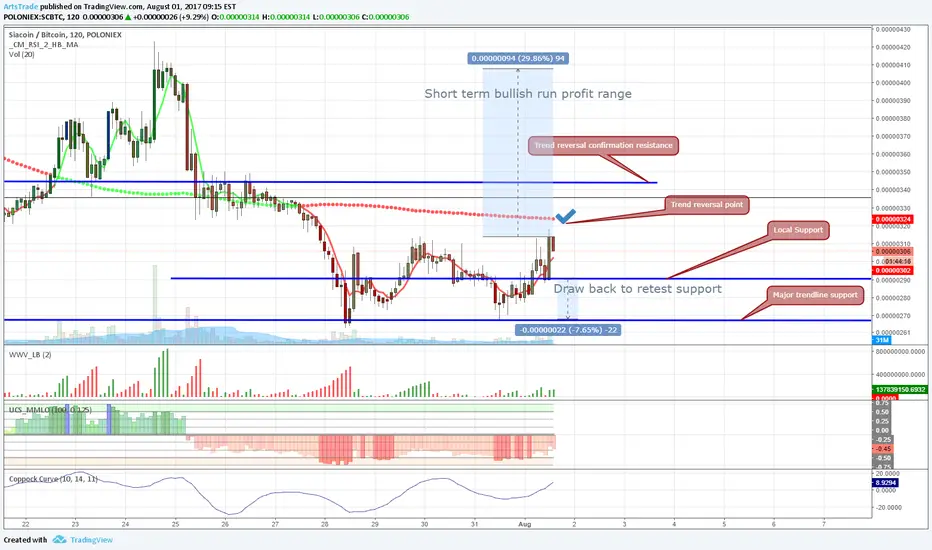
SCBTC POLONIEX08.05.2017 will most likely see SC back on its uptrend.
Confirmation of date provided by convergence of EMA50 and MA100 and UPTREND / DOWNTREND lines convergence.
Support is provided by previous lines of support (0.00000262 and 0.00000285) and by EMA200 that confirmed support on 07.11.2017 and 07.28.2017 depicted by grey area.


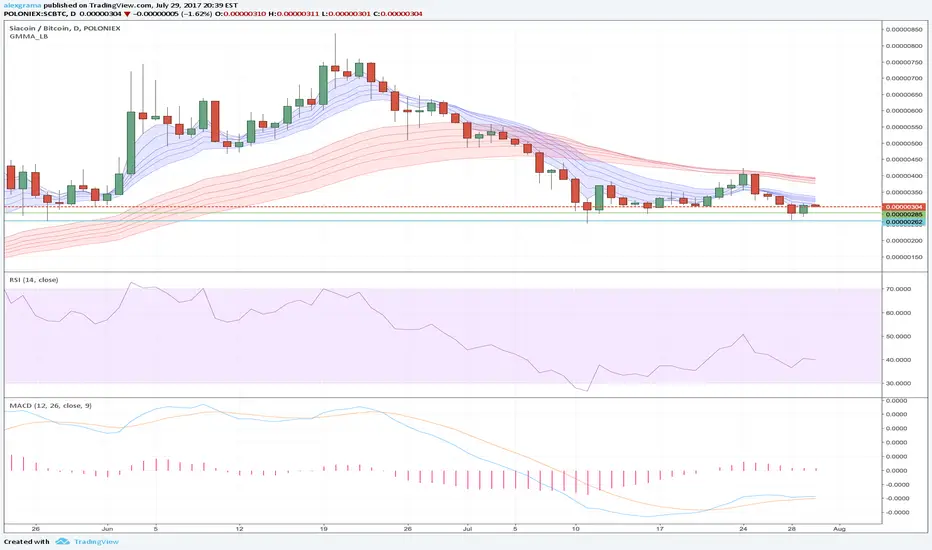
Siacoin Double BottomIf we look at the daily chart of Siacoin, we can see that the market is at the support zone. Bullish divergence and double bottom chart pattern give us a trend reversal signal. It means that we have to be ready to open long trades based on breakout signals. If price bounces from the support zone and breaks the downtrend line, it will be confirmation for further upward movement. We'll be able to open long trades with stop orders below the support zone. The next confirmation for the upward movement will be a breakout above the previous swing high. If price can break this level, we'll have a new buy signal and confirmation for the up trend. We'll be able to add some volume to the previous long positions. Profit targets for long trades should be at resistance levels. If the market breaks the support zone, we'll see downward movement to the support level and new trading opportunity.

SC/BTC scenarioWe have a possible SC scenario here, Looks a good entry around the blue shaded area. Why?
1) Volumes are pretty much down in Bittrex and Poloniex
2) There is a very strong support in 260-300 area (long term)
3) SC is oversold to the bottom
4) Don't be dumb and hold your BTC for free BCC buy as many altcoins as possible, there is a strong case that BTC will have a bullish movement after Aug. 01

SCBTC POLONIEXSC is being pushed into the corner by the intersection of Downtrend and Uptrend lines. The next 5 days will decide which path SC will take. Crossing a trend-line does not mean the trend is confirmed, further confirmation by RSI/MACD required.

SCBTC POLONIEXSC will struggle a few days to get back on the uptrend after hitting the support level, uptrend will be confirmed by RSI (when below 30) and will be further confirmed by MACD (when signal will cross with high pitch angle)
SIA/BTC POLONIEX - uptrend expectedIn the past few days SIA showed e recovery from the downtrend. I is expected to go on an uptrend with support and resistance margins as shown by the uptrend lines. The profit zone marked in green.

SCBTC quite opportunity with low risk We witnessed double Bottom formation two weeks ago. It seems like the pair formed triple bottom now with big bullish candlestick on 4h chart. I think it is good time to enter the market with low risk and quite high potential profit. Market is different from what we have seen few months ago. Be aware that it is possible that the pair will go lower.
I would set up TP area close the the next GAP on 4H which was respected while ago.

SC/BTCLooking to stay above support trendline , if not we can go down to restest fibonacci level, EMAS showing down movement, also Stochastic/RSI.

SCBTC POLONIEXSC is expected to bounce from support lines with an uptrend confirmed by MA13(in red).
SC has reached support line in green, more historical support in blue. Uptrend will be confirmed when MA13(in red) will pass through upward MA32(in blue).


Lower The Flags: Possible SC drop soonI really hope I'm wrong about this, but it looks like a reverse flag formation. Might see a big drop in SC for a while.


Up and Up: the Mid-term for SCSC has recently broken the downtrend and has shown some positive upwards movement. Looks like it will have to break out of this triangle to continue moving up.

Buy SIACoin - SC recoveringI think that if BTC continues to stay between 2500 and 3000 USD we can expect SC to go back up around 0.00000600 in the next week. If BTC does an A.T.H. and doesn't crash immediately after we should see some cool action on altcoins in general and SC in particular over next month(s).
Remember, it's just an idea, not a prediction. You trade on your own risks.
