News about Obelisk are coming soon.The first ASIC built for Sia mining. Let's see what it holds.
Analysis based on different timeframes (1/5/30min, 1/4h, 1D)
SCBTC trade ideas

SIA to break 1k sats within a weekSIA TO THE MOON. Having to up my prediction on siacoin, it looks like it is don't the 1-2-3 push again. 1k+ for sure, not sure how much the fomo past 1k will spike the price since there are almost no sell orders north of 1k. 1.2-1.3k seems reasonable and conservative.

Breakout or no Breakout: That is up to SC!Analysis based on structure 1/5/30min. Shoulder maybe touched and move could be retraced. If it crosses the ellipsis breakout may appear.
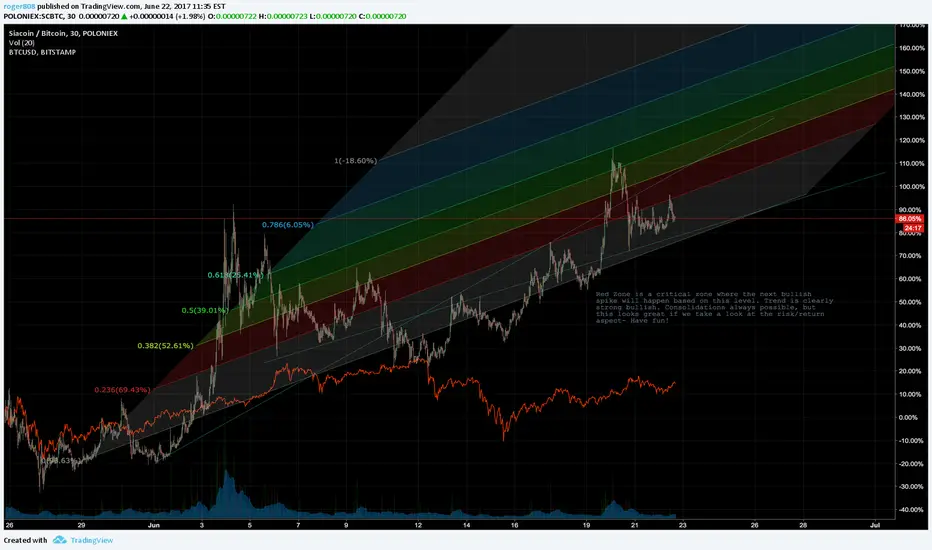
Stay green, or stay calmed!


SC/BTCSC with strong bottom
dependent on BTC
performing better than BTC
Volume Spikes shows its interest
Marketcapitalization ranking up from 21 to 14 within 3 weeks
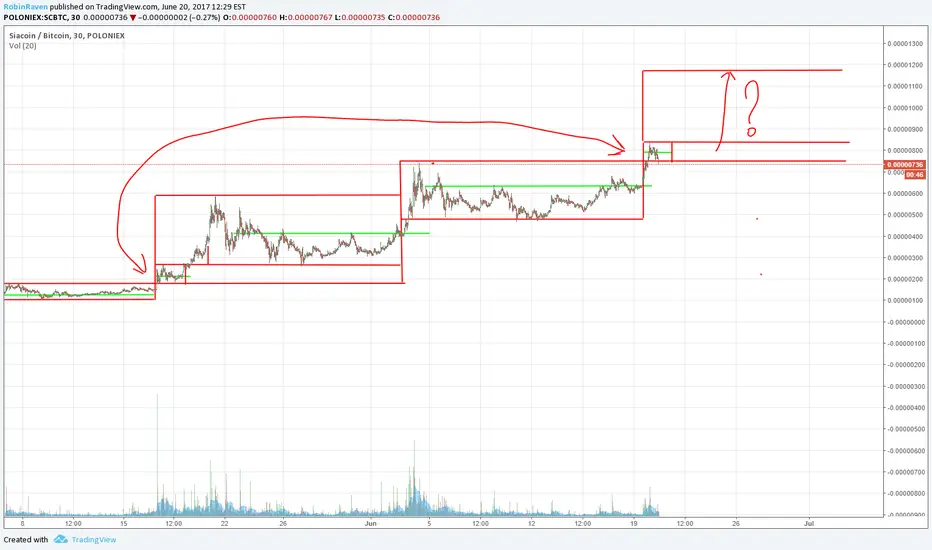
Bulkowski's Big WA nice big W with a forming handle. This is a classic one and usually confirms an upward trend.


SC Analysis and Movements at its BestThere is support at 0.00000690 if it breaks that it will go down and Resistance at 0.00000738 if it breaks that it will move upwards wait for entry points and enter the trade it looks good for the week could move to 0.00000815 if it breaks 0.00000738 and if it breaks that we can go to moon
(I expect a Move upward in the next couple of days )
All is in the Chart Explained if anything please mention in comments
These are Analysis i am displaying for you to make better decision
Trade at your own risk and be carefull to put stop loss at 0.00000680
Best of Luck

SC misses lower highnewbie here expecting missed lower high (above 750) then a measurable retracement (below 650) before rising over 800 again


SCBTC Siacoin/Bitcoin Turning Up For The EveningBullish Reversal candlestick patterns appearing on 15 minute chart for Siacoin / BTC. Risk/Downside is 5:1. Pattern continuation is a bullhorn uptrend, but a conservative sell point is an upper resistance level at around 758.

Siacoin / Bitcoin 2 hour long on descending wedgeSCBTC 5:1 Risk/Reward Descending Wedge Pattern
Low RSI, bouncing off day term resistance, descending wedge on minute chart, bottom-type 15 minute candlesticks, confirmation will be 2 green bars above 10 minute EMA


Short Trade SCBut Limit @0.00000722
Target= 0.00000809
We recommend Capital Management
We ask Allaah to reconcile and repay

SIACOIN LONG !!I will add more if the price pop out from my TL.
This will do like my last plan,
My target is 750 -> 950
Have a nice day & Great Trade anyone !!


Potential Long Swing Up to a week to play out Target 1 =0.000007Stochastic RSI indicating Oversold on the 4 Hour Chart.Looks like Uptrend might continue

