A trading opportunity to buy in SCBTCTechnical analysis:
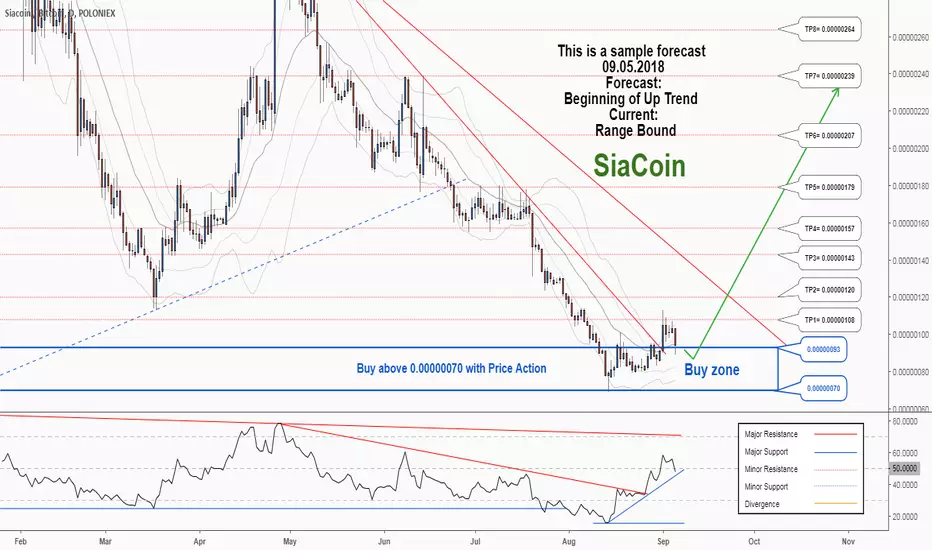
. SIACOIN/BITCOIN is in a range bound and the beginning of uptrend is expected.
. The price is above the 21-Day WEMA which acts as a dynamic support.
. The RSI is at 49.
. The RSI downtrend & The price downtrend in the daily chart are broken, so the probability of the resumption of an uptrend is increased.
Trading suggestion:
. There is a possibility of temporary retracement to suggested support zone (0.00000093 to 0.00000070). if so, traders can set orders based on Price Action and expect to reach short-term targets.
Beginning of entry zone (0.00000093)
Ending of entry zone (0.00000070)
Entry signal:
Signal to enter the market occurs when the price comes to "Buy zone" then forms one of the reversal patterns, whether "Bullish Engulfing" , "Hammer" or "Valley" in other words,
NO entry signal when the price comes to the zone BUT after any of the reversal patterns is formed in the zone.
To learn more about "Entry signal" and the special version of our "Price Action" strategy FOLLOW our lessons:
Take Profits:
TP1= @ 0.00000108
TP2= @ 0.00000120
TP3= @ 0.00000143
TP4= @ 0.00000157
TP5= @ 0.00000179
TP6= @ 0.00000207
TP7= @ 0.00000239
TP8= @ 0.00000264
TP9= @ 0.00000319
TP10= @ 0.00000393
TP11= @ 0.00000453
TP12= @ 0.00000745
TP13= Free
SCBTC trade ideas

A trading opportunity to buy in SCBTCTechnical analysis:
. SIACOIN/BITCOIN is in a range bound and the beginning of uptrend is expected.
. The price is above the 21-Day WEMA which acts as a dynamic support.
. The RSI is at 49.
. The RSI downtrend & The price downtrend in the daily chart are broken, so the probability of the resumption of an uptrend is increased.
Trading suggestion:
. There is a possibility of temporary retracement to suggested support zone (0.00000093 to 0.00000070). if so, traders can set orders based on Price Action and expect to reach short-term targets.
Beginning of entry zone (0.00000093)
Ending of entry zone (0.00000070)
Entry signal:
Signal to enter the market occurs when the price comes to "Buy zone" then forms one of the reversal patterns, whether "Bullish Engulfing" , "Hammer" or "Valley" in other words,
NO entry signal when the price comes to the zone BUT after any of the reversal patterns is formed in the zone.
To learn more about "Entry signal" and the special version of our "Price Action" strategy FOLLOW our lessons:
Take Profits:
TP1= @ 0.00000108
TP2= @ 0.00000120
TP3= @ 0.00000143
TP4= @ 0.00000157
TP5= @ 0.00000179
TP6= @ 0.00000207
TP7= @ 0.00000239
TP8= @ 0.00000264
TP9= @ 0.00000319
TP10= @ 0.00000393
TP11= @ 0.00000453
TP12= @ 0.00000745
TP13= Free
SCBTC - Finding bottom - xuanhaimmoerGuys, SC/BTC has long term for downtrend,I hope we just need wait for several time to buy SC in BUY ZONE and keep hold it for long term.
The target in the chart
Thanks all you guys for reading and dont forget LIKE it!


$SC Pathway 5HR Time Lapse - These fast forward views after several weeks can be exciting sometimes. Lets see what happens.
Long Bias, but firmly now understand, that the market could give a Capital F where we think or believe it is headed...

SC – Sia coin – Hard Fork is coming – profit/loss ratio 963%Hi Guys!
Most of you already have heard about the hard fork of Sia.
We read about that a lot and we think this is a good idea.
To make the long story short.
They produce their own ASICs. They are called Obelisk SC1. They are used to dig Sia coin and maintain the whole network. Everyone can buy them.
However, ASCIs from Bitmain which are also used in Sia network, determine almost 45% of the whole hash power rate. This looks a bit dangerous when taking into account potential growth of dominance of Bitmain and their hardware. Within a weeks/months they could exceed the level of 51% and if they are intentionally very mean, take over the whole network. So (almost) none of the creators want such situation. 51% owned by one company? No way!
So, as a result, they decided to change the algorithm and unable Bitmain and Innosilicoin to operate in Sia’s network.
So within the last couple of days, SC grew over 20% which constitutes the fact the community has taken this information as a good omen.
The hard fork will come into effect by the October 31st. There’s no plan to issue new coin. If somebody will do it, basing on the old network, the new coin might be issued but there are no guarantees that any exchange will support it.
Technical analysis details:
• Very low at the Fibonacci scale (only 70 sat over minimum value)
• Probably double bottom forming
• Ichimoku Cloud - over Tenkansen and the cloud – strong bullish
• MACD – bull’s cross over the level of 0
• Chaikin Money Flow – strong pressure on the price is getting even stronger – take a look at the angles.
Fibonacci targets (this can take a while as those are taking into account whole price span):
Target 1: 0.00000235
Target 2: 0.00000353
Target 3: 0.00000457 (end of double bottom)
Target 4: 0.00000544 (mid-term)
Target 5: 0.00000679 (long-term)
Target 6: 0.00000852 (long-term)
So, as a result, we can lose 70 sat and win 730 sat which makes a great profit/loss ratio at the level of 963%.
So do you think hard fork will have a positive influence into Sia’s future?
Are you hodlers of this project or you just trade?
Massive Hugs!
WBM Team

Siacoin update 04 OctoberSiacoin has been gaining momentum during this week. Volume has increased considerably. Price right now is at 121 sat. I see a small retracement taking place and could continue during today. I see 2 bearish signals what made me close my position at 124 sat.
1) Bearish cross over on the MACD 1 hr -2.46% -2.46% chart.
2) Bearish divergence between price and RSI on the 1hr chart.
I expect a retracement to the 0.5 fib or 0.618 fib levels.
Strong support by the ichimoku cloud at 110 sat and 50MA.

SCBTC $SC $BTC LONGSCBTC $SC $BTC breakthrough long triangle resistance as daily candle closes confirming a long term BULLISH trend. Getting fuelled by long term accumulation, as we get out of the bearish market


SiaCoin Bottomed?I always love such pattern which predictable for everyone to see. The season on SiaCoin chart told us that #HODL is not always good enough. Pretty much this level will be my accumulation zone and looking for easy 100% in coming weeks/months.
This sentiment also depends on BTC movement so becareful, the second long green box is another accumulate phase which is will be worth to hold. SiaCoin (SC) right now is #41 rank on Coinmarketcap.com which the growth and also the endurance of bear market that SiaCoin has survive. Plus it is one of the low sats that you might interested to invest.
Safe trade!

Siacoin, Bullish Or Bearish?Siacoin seems to have been following a nicely painted pattern, where previous resistance turned support, following a nice upswing with good profit %. Shall we see what happens Or do we buy now close to support?

SCBTC in for the LONG runSC passed the local downtrend a few weeks back(ANGLED DASHED RED LINE)
SC just passed the downtrend resistance (ANGLED RED LINE)
We are in for a recovery of SC with some local resistance but only a major resistance at 200+ sats.
if you got in, be happy for your choice. If you are not you should strongly consider as the trend will develop fast (given previous rises of SC, 30-40 days it took previously to go up between 300% up to 600%).
Be safe and do not gamble, make a plan with Take profit and Stop loss.
Best of luck.

(Update) Hello Sia! Next Chandelier is here; Marathon & The b...This is an update to the previous idea just to clear out where we have reached, we are starting to cross the MA100, we seem to be breaking out right on time, make sure to checkout the original chart:
-- small request: Like the chart to receive updates and provide me with insights as i don't usually make Sia charts :)
Good luck with your trades


passing 1 year bear line.. long looks promissing uptrend Target (Unknown) stop loss (80 sats) Buy back (50 sats)

Siacoin for a bullruneverytime Siacoin has a 100MA-200MA crossover in the 8hr timeframe, has a bullrun.

Hello Sia! Next Chandelier is here; Marathon & The Big Picture..The chart is self-explanatory but if in a few words; this is the classic MA100 MA50 battle. As you can see back in October/November '17 same story occurs:
- MA50 Resists (Check)
- MA50 Breaks (Check)
- MA100 Resists (Check)
- MA100 Breaks (Check)
- Bull (Check)
Today we are:
- MA50 Resists (Check)
- MA50 Breaks (Check)
- MA100 Resists (Check)
- MA100 Breaks ( ... )
- Bull ( ... )
-- small request: Like the chart to receive updates and provide me with insights as i don't usually make Sia charts :)
Good luck with your trades

Boys, we're on the right track. SCBTCRecent months have witnessed a substantial decrease in the activities of trading volume, but starting from September I have noticed an increased amount of "buying" strength. Well, this is the time for flat trading, without spikes or big volumes at the market... At the moment we can assume that price ended its downtrend period so we can put small orders atm during the accumulation session without high risks.
The MACD: Bullish crossover
The RSI: < 50
EMA lines: the 7EMA is finally our support line, the 30EMA resistance line @110 and the 100EMA created the strong resistance level @160.
ENTER: 90-95;
PT: 160 and higher.
Conclusion: I don't follow the Sia very closely but remember their team has the good project which can resolve issue with cheap hosting of your data, and why not? Maybe this tech will be in demand at 2019.


Back-testing 10d MA/ 20d MA strategy on SiaCoin... it checks outlooks good here too
added MACD, seems to lag a bit less as an indicator
but, if u had played the MA cross strategy last winter, you would have gotten in at around 60 sats, out at 362 sats
it really doesn't get much better than that
will continue to poast back-tests
interesting to note that the MAs look ready to bullish cross again
Chad's been in since 86
will update this trade as it progresses


Siacoin - Huge Growth PotentialThe daily chart looks promising. Volume is picking up and Siacoin stays strong during BTC price drops.
I'm expecting SC to move to the first resistance in the next 4 days.
Siacoin is a great long-term hold either way. It's very easy to profit from this coin.
Buy: 90 - 95
Target 1: 120
Target 2: 140
Target 3: 180
Risk: Low
Stop Loss: 88
Let me know what you think!

