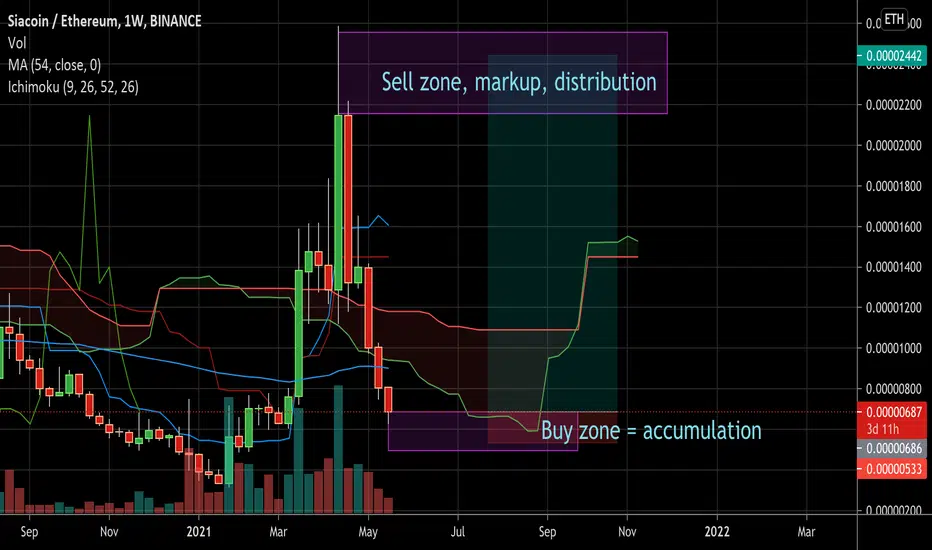
is 270% really possible?SC/ETH is like LSK/ETH a rarely looked trading pair but both have good potential to outperform.
Take care those are very high risk trades i am willing to enter and throw some ETH into.
As the past activity shows the % of upthrust are enormous and indicators leading into such mania could be around the corner.
Trade safe and no trading advice
SCETH trade ideas

Sia coin can 5x your ETHSia Coin on monthly chart against Ethereum has given a HH.
Therefore expecting it to hold previous Low as HL.
Next Target for HH marked on Chart.
#Active Portfolio Management
#Strategic Trading

Pure PatternJust like the rising wedge , the falling wedge can either be a reversal or continuation signal.
As a reversal signal, it is formed at a bottom of a downtrend, indicating that an uptrend would come next.
As a continuation signal, it is formed during an uptrend, implying that the upward price action would resume. Unlike the rising wedge , the falling wedge is a bullish chart pattern.
In this example, the falling wedge may be predicted as a reversal signal after breaking resistance zone . After a downtrend, the price made lower highs and lower lows.
Notice how the falling trend line connecting the highs is steeper than the trend line connecting the lows.

SC/ETH Request @goodvibe being accumulated in alt alt ratioNotice the structural difference and accumulation pattern in eth ratio versus fiat base pair, cup and handle
almost falling wedge looking
your math is weekly daily 4 hour confluence, and critique
you must always account for fiat base, BTC ratio, ETH ratio, and hopefully any other perspective...
and each subjection analysis
so is this a combination or permutation...?
for instance BNB... no comment
big boys bot each market for supply, as well you must take in account exchange liquidy
mantra aint no coin, no comment posts
as well, the lower the nominal price action the greater ROI premise
you will only get a 10X on BTC ETH LTC
versus
you can get infinity ROI on #shitcoin SAFE IOST DGB VET and so on
if you have profits dont gamble on these exchanges
CapEx on miners, nodes, staking/secure network, yield(matic only please; gwei gay), passive
going into solstice... mitigate risk, preserve principal
CryptoCurrencyConsultant
.3 LTC 30 day member
.6 LTC lifetime member
.9 LTC exclusive crypto coaching
Lf55wxFjbSrmsYnscjtrDLNZoZFLjJPs8U
SCETH Atlantis discovered reversal of trend going UP!I call this atlantis its the opposite of a UFO when a body of candles is left with gaps on the left and right the result is a reverse in trend.
SCETH going up.
by iCantw84it

Interesting⚡️Looks like market is recovering, folks🔥
That's why there is one more interesting formation for you.
Flag formation on SC/ETH crypto pair.
Price already made two main parts of this pattern: flag and flag pole.
Price multiple times bounced from support and resistance zones and now is heading to the breakout.
Price target is around 0.00002590 zone.
So follow the chart and look for the breakout carefully.
_____________________________________________________
If you enjoy my FREE Analysis , support the idea with a big LIKE👍 and don't forget to SUBSCRIBE my channel, you won't miss anything!
Feel free to leave comments✉️
And always remember: "we don't predict, we react".

Sia COIN /SCETHThis is a 15 min chart break down of what we should be seeing from this Crypto. The white line is the minimum and the yellow is the reach. The red would be the max.
wait for the daily.
iCantw84it

SCETH to ETH back to SCETH Play Made 40% Bought SCETH Last night gained 40% Sold into ETH for the drop. Will pick back up off trend line below to ride back up and then sell again.
iCantw84it

SCETH Trade OutlookPrice is sitting now at the green trend line of the pitch fan. The price action now shows potentials of a reversal. There may be chances of a bear trap before the bull run. For you not to miss any update, follow, like or comment. Thank you for your support. Trade with PROFITS.


SIACOIN Weekly Bullish Breakout FormationSuper Bullish on this project and currently undervalued at a market cap of only $140 Million.
Do look for a close above the weekly resistance from the pattern drawn above.

SCETH, Sell on H4.SCETH, Sell on H4.
H4:
- Structure: Downtrend
- Tendency: Downward
- Pattern: Double top pattern
- Candle: Bearish outside bar
- Below resistance
--> PLAN:
- Sell
- Take profit: As picture

SCETH, Sell on H4.SCETH, Sell on H4.
H4:
- Structure: Downtrend
- Tendency: Downward
- Pattern: Double top pattern
- Candle: Bearish outside bar
- Below resistance
--> PLAN:
- Sell
- Take profit: As picture


SCETH - Waiting for signal to SellWe wait for price to come back to the resistance and give a good confirmation of rejection then we can sell

Sia Coin going UPSiacoin news and updates are growing every day the price of the coin.
I'm seeing this coin very potential that will grow up to 0,009 in two days.
Please leave your comment and share your idea referring Sia Coin
