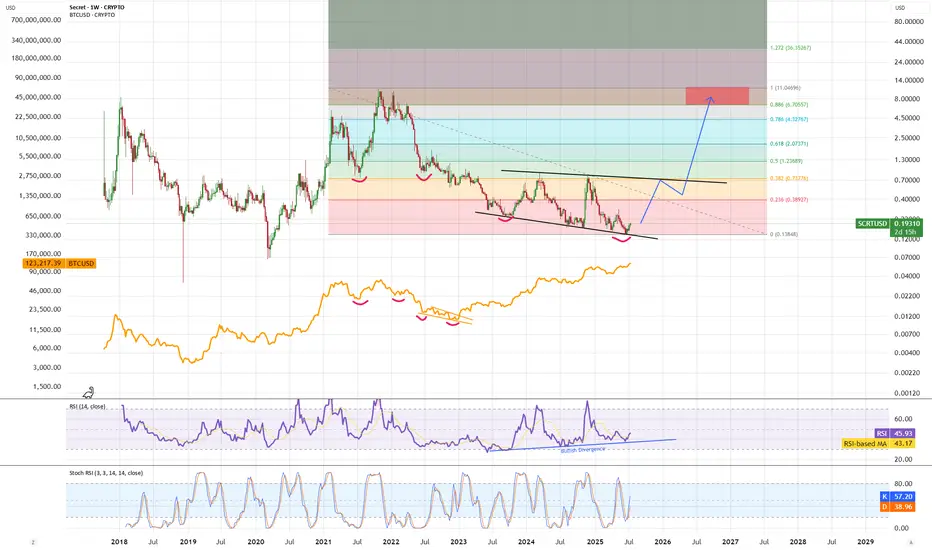
SCRT - correction over?SCRT developed bullish divergence and has corrective structure similar to BTC before it reversed. I expect bounce up to diagonal resistance line, consolidate a bit and then breakout toward ATH range where again consolidation time.
SCRTUSD trade ideas
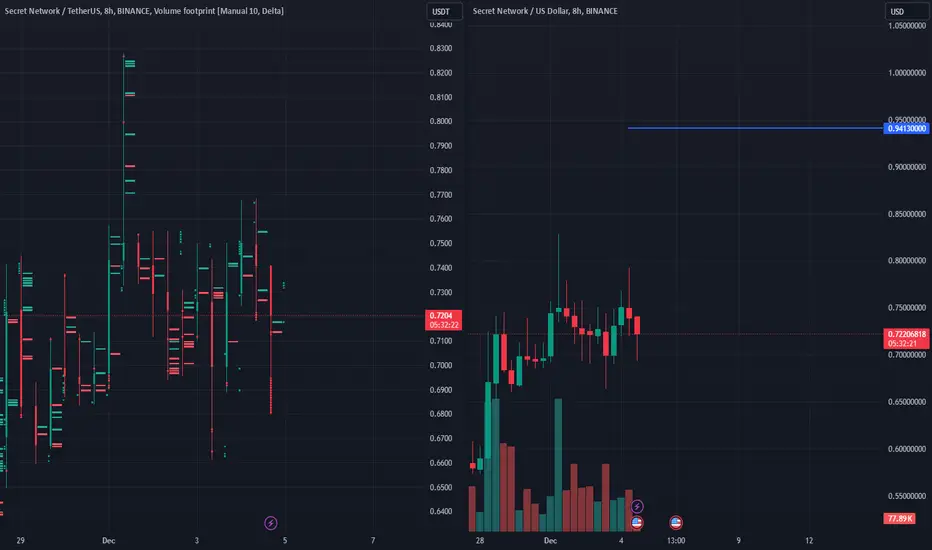
Insanely bullish volume for SCRT. First target is 6$+Very large buys indicate extraordinary demand for the token. Trading volume increased to 400M tokens per day, usual volume is around 30M daily.

SPOT SCRT LONG 4.12.2024🎯Purpose:
0.9413
‼️We enter at 0.5% of the allocated money for spot trading.
SCRTUSDT-Update#SCRTUSDT
UPDATE
Falling Wedge Formation in D1 Timeframe✅
In case Of Successful Breakout,Expecting 60-70% Bullish Wave📈

SCRT Weapon - Primed and ready for a cloud edge to edgeSecret network a crypto in the privacy space thats been around a long time is looking primed and ready, already breaking out of a inverse head and shoulders we could see an attempt at the other edge of the cloud.
Waiting for a weekly close in the cloud to execute a buy, will set stop just below the bottom of the cloud. Nice and easy swing trade potential with good R:R.
Once activated, I will take profits on the way up, could take a few months or more to play out.
If its rejected from the cloud thats not good, I will stay on the sidelines.
NFA

Scrt buy target to avg down from here. Hello, longtime no see. Now that we have some volume back and high interest in BTC as well as a somewhat bullish stock market sentiment, it is fair to assume that scrt might be a in a good position to test the 1$ and more. Of couse, the network has had some share of issues. It is still in early development but has great use cases and potential.
I think scrt is a buy today with an averaging down buy target has shown by the yellow line.
What’s your opinion?

$SCRT above bull market support band after inflation % decrease$SCRT - The native coin of confidential computing project Secret Network looking strong after the recent reduction of inflation to 9%.
The vote passed with overwhelming support from validators on the network: www.mintscan.io

SCRT/USD 4HSecret/USD has broken the rising channel to which it was respecting , also a break of structure has happened , we can short here now for a small trade and aim for 0.632 level before it reverse.

scrt ready to buy i am bullish on altcoins and in my opinion we will have a bull run in next days
so as you can see scrt is close to very nice point to long and i will long it at the point that i determined
the best way is to wait till see we see a bull candle at 4h time frame

SECRET - Blocked in a short term rangeAfter a huge retracement, prices found support on the 0.57$ area, one of the most important long term support.
This box show a range scenario, without strong interest from investors on this project for the moment.
Two main scenarii :
First : prices break the resistance at 0.92$
So the activity should be back and the token will be able to go back at 1$ and 1.40$ as second extension.
Second : Prices break the support at 0.57$
Then, expect another leg down to a lower support, at 0.47$.
This short term range should be monitored during the next few weeks !

SCRT Opportunity Gold opportunity on SCRT. Will be looking for a daily closure above 0.87 before entering a long. This could easily 2-5X.
Cheers

Time to swap your PoW monero's for a PoS alternative?Im looking for a correlation between the protocols, just an idea. No trading advice.

I want to say one Secret.Look this beautiful chart, nice structure long time.
Here time to buy a bag. :)

#SCRT Long on breakoutSCRT Long on breakout of ascending triangle after a double bottom. Short term trade or entry for longer term hodl.

Buy and Hold ? Look at altcoins, BTC and the marijuanaFor the younger generation and many others, if you bought and held some specific sectors...you have been rekt. Sorry!
ACB?
WEED?
SCRT?
BTC?
BABA?
SCRT has been on an incredible ride, which we took very advantage off. See my related idea below about SCRT going to 8$. There is a moment to be in and a moment to be out. Buy and hold may be good strategic in some cases but there seem to have a negative view of the traders mindset. Those whose play the game of swings and emotions as well as rationalise via technical and fundamental indicators. We each have our own strategic way of using the financial system. To me, the last couple of years demonstrated how risky it is to buy and hold. My trades were on those sectors mentioned. If I held any of my past positions. I would not be near where I stand today. Probably because I seek risk asset. But that's also where a lot of money can be made.
It depends on your risk tolerance. A good technical trader that knows how to deal with its emotions and follow the hype will beat the market and exceed any long term trading mentality. You have to play the game. And you can get good at it, not like the casino. It's more, are you that type of person?
I think now might be a good time to get your toes in the water in some assets you are interested in. There is still downturn possibility. Just be patient.

SCRT continues to trade within the accumulation zoneThe SCRT USD pairing has settled nicely within the accumulation zone. We will monitor the volume and progress of SCRT and if it breaks the $2.00 mark on the daily time-frame and consolidates we could expect a run to the mid to high $3.00 area.

SCRTUSDTHello Crypto Lovers,
Mars Signals team wishes you high profits.
This is a one-day-time frame analysis for SCRTUSDT
Here we have R1 as our resistance line and the unsuccessful attempts of the price to rise is obvious. And S1 and S2 are the support areas that contain the support of the price at some points. At the moment, we have the price fluctuating over S1 and we consider a falling trend to this line like its past trend. By reaching here, we have two scenarios for the price. Either we will receive some confirmation candles to rise and an increase is expected for the price to R1 or higher. Or the price will lose the support here and start a decline toward S2. Let's wait and see what future reveals for us.
Warning: This is just a suggestion and we do not guarantee profits. We advise you to analyze the chart before opening any positions.
Wish you luck


SCRT longSCRT bounced off the ascending trendline. Asset broke through the descending trendline. Bullish movement to resistance level at 1.34 is possible.

SCRT - A recovery Scrt slowly coming back . Maybe it stays in the new zone at hits 4$ range before coming back down . The other option is that it is strong enough to test the top again

Secret MoneyTrendmaster + Overwatch decimating once again. near 50% move. Price gave another opportunity falling back into over watch lower boundary / Price double bottom before the run up.

SCRT, seriously oversold.The following content is machine translation:
On the daily chart, it continues to fall this year. It closed positive yesterday, ending this year's decline. It continues to rise today and is expected to rebound.
The market has continued to fall recently. The speed and slow lines of the indicator macd are scattered below the zero axis, and the energy column is running above the zero axis, which is seriously deviating from the k-line. The RSI indicator deviates from the bottom of the oversold zone and begins to shift to more today, and is expected to rebound continuously.
In terms of operation, there is a serious deviation from the bottom. At present, there is a change to more, and more, and the stop loss falls below the low point of yesterday.

SCRT USD probably a dead coinA friend I know likes this Secret thing, I'm trying to fix that with a nice bear chart to check on over the next couple months. Enjoy!
