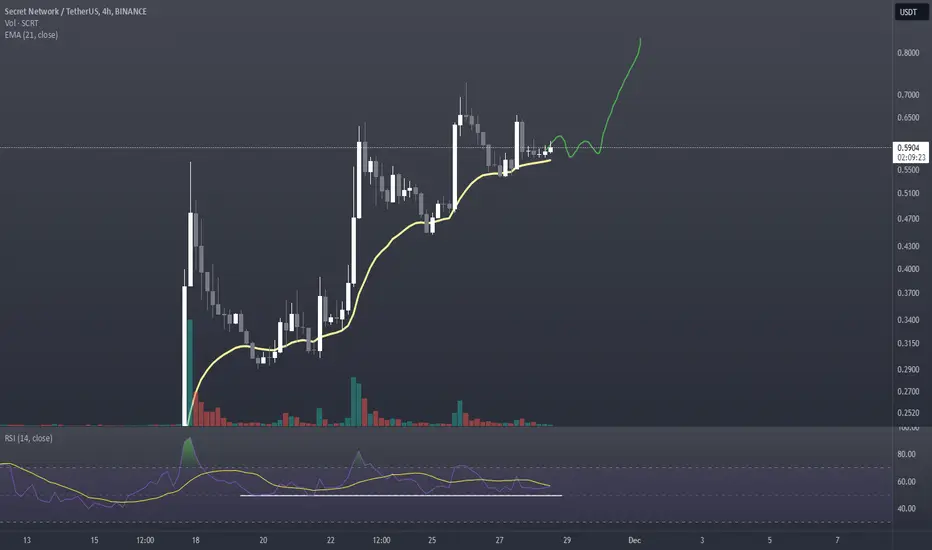
SCRTUSDT Analysis: Patience is KeyThe blue box highlighted on the chart serves as a high-quality demand zone for potential buying opportunities. With a %1170 increase in daily volume , this area demands attention, but patience will be crucial for the right entry.
Highlights:
Demand Zone: The blue box is a well-defined region based on significant metrics.
Market Context: The increase in volume suggests active market participants.
Patience Pays: Wait for confirmation before taking action.
Confirmation Tools:
When trading the blue box, I use the following to ensure precision:
CDV (Cumulative Delta Volume)
Liquidity Heatmap
Volume Profile
Volume Footprint
Upward Market Structure Breaks on Lower Time Frames
Want to Learn?
If you're interested in mastering these tools and techniques, DM me for insights on identifying accurate demand zones and trading smarter.
Final Note:
Risk management is key, and adapting to market dynamics is essential for success. Trade wisely, and best of luck!
SCRTUSDT trade ideas

$SCRT PUMP ALERTNOTES
Asset/Instrument : SCRTUSDT
Timeframe :1 H
Market Condition : BULISH
Reason to Buy/Sell : BULLISH FALLING WEDGES
Target Price/Profit Area : $ 0.92

$SCRT SECRET CUP AND HANDLE ALERTNOTES
Asset/Instrument : SCRTUSDT
Timeframe : 15m
Market Condition : BULLISH
Reason to Buy/Sell : BULLISH CUP AND HANDLE PATTERN
Target Price/Profit Area : $ 0.77

Scrt chart - key levelsScrt chart key levels.
Every level can reject to a new low or offer support and push it to the next one up.
The targets are valid if the price hold support at current level.

SCRT Help MeIn this daily chart projection of Secret (SCRT) USDT, the strongest resistance level is expected above the 1.2250 price mark. Avoid entering with leverage, as the Binance chart shows excessive manipulation compared to other exchanges.
My strategy is to exit this token at that resistance level and re-enter at a lower price since it holds significant potential.
If anyone follows this currency, I would appreciate your opinions. Thank you all for the trust shown in my projections.
Please note: My projections are not intended for individuals under the age of 18.
Efe_Efe.

HEDGE TO THE LONGSAlthough my general opinion is still bullish, you never know what the prices will do, so I think the volume increase during the decline in the secret can take it to lower levels, and if you carry many longs, I find it logical to open a short as a hedge against the longs.
My Previous Ideas
DOGEUSDT.P | 4 Reward for 1 Risk much more if you hold it.
RENDERUSDT.P | HTF Accuracy
ETHUSDT.P | Accurate Buyer Zone Identification | High Risk Reward if you hold it.
BNBUSDT.P | Accurate Buyer Zone Identification | High Risk Reward if you hold it.
Bitcoin Dominance | Great Characteristic Detection and Accurate Analysis

Scrt key levelesScrt key levels.
Each level can reject to a new low or offer support and push the price higher.

#SCRT/USDT#SCRT
The price is moving within a bearish channel pattern on the 12-hour frame, which is a strong retracement pattern
We have a bounce from a major support area in green at 0.2150
We have a tendency to stabilize above the Moving Average 100
We have an upward trend on the RSI indicator that supports the rise and gives greater momentum, upon which the price is based higher at the discount
Entry price is 0.2300
The first target is 0.2976
The second target is 0.3577
The third goal is 0.4280

SCRTUSDT (SecretNetwork) Updated till 17-11-24SCRTUSDT (SecretNetwork) Daily timeframe range. over 159% pump in a single day today. great gains made by the peoples who bought at local low. now it do have more space to cover if it can stay above 0.3482. staying above 0.3482 can make things easy here.

#SCRT (SPOT) entry range ( 0.1780 - 0.2080)T.(0.5580) SL(0.1693)BINANCE:SCRTUSDT
entry range ( 0.1780 - 0.2080)
Target1 (0.2370)- Target2 (0.2790)- Target3 (0.3910)- Target4 (0.5580)
SL .1D close below (0.1693)
*** Collect slowly in the entry range ****
**** #Manta ,#OMNI, #DYM, #AI, #IO, #XAI , #ACE #NFP #RAD #WLD #ORDI #BLUR #SUI #Voxel #AEVO #VITE #APE #RDNT #FLUX #NMR #VANRY #TRB #HBAR #DGB #XEC #ERN #ALT #IO #ACA #HIVE #ASTR #ARDR #PIXEL #LTO #AERGO #SCRT ****

Secret Network Easy Target (Beyond 1,000% Long-Term Potential) Let me start by saying that this is an easy target, what is shown on this chart. The full potential for Secret Network in 2025 goes well beyond 1,000%, much more than that. But we are keeping it sweet and short for this chart.
We have a new All-Time Low being hit recently, coupled with a strong bullish harmonic pattern; the shark. A "shark" when the second part produces a higher high as well as a lower low compared to the first part of the pattern.
Ok. Classic reversal pattern. Trading volume on this pair is really strong.
There is potential for growth.
Quick, easy and sweet.
➖ Alan, what's your strategy?
➢ Buy and hold!
➢ Buy everything in the remaining portion of 2024.
➢ Hold no matter what happens, just hold.
➢ Wait patiently and joyfully through 2025.
➢ Sell when euphoria sets in or when Bitcoin and the rest of the market start hitting new All-Time Highs.
Namaste.

SCRT: At its Lowest Point!Hello everyone, I’m Cryptorphic.
I’ve been sharing insightful charts and analysis for the past seven years.
Follow me for:
~ Unbiased analyses on trending altcoins.
~ Identifying altcoins with 10x-50x potential.
~ Futures trade setups.
~ Daily updates on Bitcoin and Ethereum.
~ High time frame (HTF) market bottom and top calls.
~ Short-term market movements.
~ Charts supported by critical fundamentals.
Now, let’s dive into this chart analysis:
SCRT is at its all-time low range.
Recently, SCRT made a new all-time low of $0.1692 and hasn't been able to recover so far. Interestingly, the RSI is forming a bullish divergence, indicating that a rebound could take place soon for SCRT.
If SCRT manages to pull this off, we could see a 350% gain. However, if it fails, it will likely make a new all-time low.
Key levels:
- Primary Support/Accumulation: $0.1692 to CMP.
- Primary Resistance: 21 EMA at $0.3072.
- Target: $0.877.
- RSI: Bullish Divergence.
DYOR. NFA.
Please hit the like button to support my content and share your thoughts in the comment section. Feel free to request any chart analysis you’d like to see!
Thank you!
#PEACE

SCRTUSDTWe can attempt to buy SCRTUSDT from specified level if it break LH , also bullish divergence occur indicate that it moves upward.
SL , TP mention in chart.

SCRT/USDT Daily Analysis Potential Take Profit and Stop LossBINANCE:SCRTUSDT
To analyze the image and provide potential Take Profit (TP) and Stop Loss (SL) levels, I'll interpret the chart based on typical trading strategies. The chart shows a price action graph of Secret Network (SCRT) against Tether (USDT) with visible supply and demand zones, as well as volume profile data.
**Key Observations:**
1. **Demand Zone:** Around 0.24 USDT.
2. **Supply Zones:** Multiple levels, notably around 0.88 USDT.
3. **Volume Profile:** High activity around 0.30 - 0.45 USDT.
### Suggested TP and SL Levels
**Take Profit (TP):**
1. **First TP:** Near 0.4720 USDT – This is a level with high volume activity and a minor resistance zone.
2. **Second TP:** Around 0.88 USDT – This is a significant supply zone and a previous high, indicating strong resistance.
**Stop Loss (SL):**
1. **First SL:** Around 0.2383 USDT – Just below the demand zone, to account for false breakouts.
2. **Second SL:** If you want a tighter stop, consider 0.2446 USDT – This is just below the first demand zone level.
### Strategy
- **Entry Point:** Assuming an entry around the current price of 0.3060 USDT.
- **First TP at 0.4720 USDT:** This offers a potential gain of approximately 54%.
- **First SL at 0.2383 USDT:** This gives a potential loss of about 22%, providing a risk-reward ratio of approximately 2.5:1 for the first TP.
Adjust these levels based on your specific trading strategy and risk tolerance.


SCRTUSDT-Falling Wedge BreakoutHello
Lets Tak About #SCRTUSDT
The Falling Wedge Breakout Has Already Done ✅
Bullish Move of 110% is expected

#SCRT/USDT#SCRT
We have an ascending channel pattern. On the 12-hour frame, the price is moving inside it and adhering to its boundaries well.
We have a support area in green at 0.3500 after the price touched it and bounced from it.
We have a trend to stabilize above the moving average 100.
We have an upward trend on the RSI indicator that supports the price upwards.
Entry price 0.4160.
First target 0.4810.
Second target 0.5333.
Third target 0.600

SECRET NETWORK (SQRT)Secret Network (SCRT) is a unique blockchain platform designed to support privacy-preserving smart contracts. This capability allows developers to create decentralized applications (DApps) that can utilize encrypted data without revealing it on the blockchain, thereby providing a layer of privacy that is not available on traditional blockchain systems.
Currently, the price of Secret Network (SCRT) is $0.38 with a 24-hour trading volume of $18 million. SCRT has experienced a growth of 12% in the last 24 hours, suggesting a robust interest from the market in privacy-focused blockchain solutions.
Given the increasing importance of data privacy and Secret Network's pivotal role in this sector, the next price targets for SCRT might be set at $0.64, $0.72, and $0.96. Traders might consider entering a position now. This trade idea is based on the ongoing demand for enhanced privacy in blockchain transactions and the strong performance indicators shown by SCRT.

#SCRT/USDT LONG#SCRT
Since August 2022, the price has been moving in a bearish flag pattern that was broken to the upside
We are about to break the Moving Average 100
Current price 0.3900
First target 0.5734
Second target 0.8373
Please pay attention to the correction areas on the chart

SCRT Price Surge Alert! 📈 - Your Path to Wealth Starts HereSecret (SCRT) - Fundamental Analysis and Recent News (as of March 28, 2024)
Secret Network is a privacy-preserving blockchain platform built on Cosmos. Its key feature is secret contracts, which allow developers to build decentralized applications (dApps) that process sensitive user data without revealing it on the blockchain. This is achieved through a combination of encryption techniques and trusted execution environments (TEEs).
SCRT is the native token of Secret Network. It's used for:
Staking: Earn rewards for securing the network.
Governance: Vote on proposals to shape the future of Secret Network.
Transaction fees: Pay for network transactions and smart contract executions.
Recent News:
SCRT price is on the rise this week, up over 6% in the last 24 hours.
Secret Network 2024 Roadmap focuses on bringing confidential computing to other blockchains like Ethereum, potentially increasing SCRT's utility.
SCRT Labs Grants Program is open for Q2 2024, providing financial support for developers building on Secret Network.
Disclaimer:
The information provided here is for informational purposes only and should not be considered investment advice. Cryptocurrency prices are volatile and can fluctuate significantly. Before making any investment decisions, you should always conduct your own research.

SCRT 3MI just saw a post about European Union banning anonymous crypto payments over €3,000 using self-custody wallets.
I don't know how they will manage to ban what they can't control
But that makes me think
Privacy coins pump soon ?
Here's a 3M chart of SCRT that seems bullish
But don't follow blindly, please DYOR
Nfa
Educational purpose only

SCRTUSDT.1DOn the daily SCRT/USDT chart, here's my technical analysis:
Zig Zag Indicator: The zig zag pattern illustrates the asset's volatility with sharp upward and downward movements. The current pattern indicates a bullish movement has occurred after a prolonged downtrend.
Resistance Levels (R1 and R2): The chart indicates two key resistance levels at approximately 0.9279 USDT (R1) and 1.059 USDT (R2). These are levels where the price previously encountered selling pressure.
Support Levels (S1 and S2): Support is noted at 0.6086 USDT (S1) and stronger historical support at 0.4521 USDT (S2). These are the levels where buyers have stepped in previously, offering potential bounce points if the price were to decline.
Moving Average Convergence Divergence (MACD): The MACD line is above the signal line and the histogram bars are positive, suggesting bullish momentum. However, the diminishing height of the histogram bars could imply that the bullish momentum is waning.
Relative Strength Index (RSI): The RSI is around 70.49, hovering at the edge of the overbought territory. This can sometimes predict a forthcoming price pullback or consolidation.
Conclusion:
Given the strong recent upward move and the RSI at overbought levels, I'd be cautious about initiating new long positions at this point due to the potential for a reversal or consolidation. Instead, I might consider taking profits if I were currently in a long position, especially as the price approaches the first resistance level (R1). If I were looking for entry points, I'd watch for a potential retracement toward support level S1, which might provide a more favorable risk-reward ratio.
However, I must keep in mind that overbought conditions can sustain in a strong bull market, so I'd also be prepared for the possibility of the price breaking through R1. In such a case, I'd look for increased volume and a strong MACD as confirmation before considering further long positions, potentially targeting R2. I would also remain vigilant for any bearish signals from the MACD or RSI, which may prompt me to reassess my position. Technical analysis is one tool among many, and it's vital to stay informed about broader market trends and updates that could impact price action.
