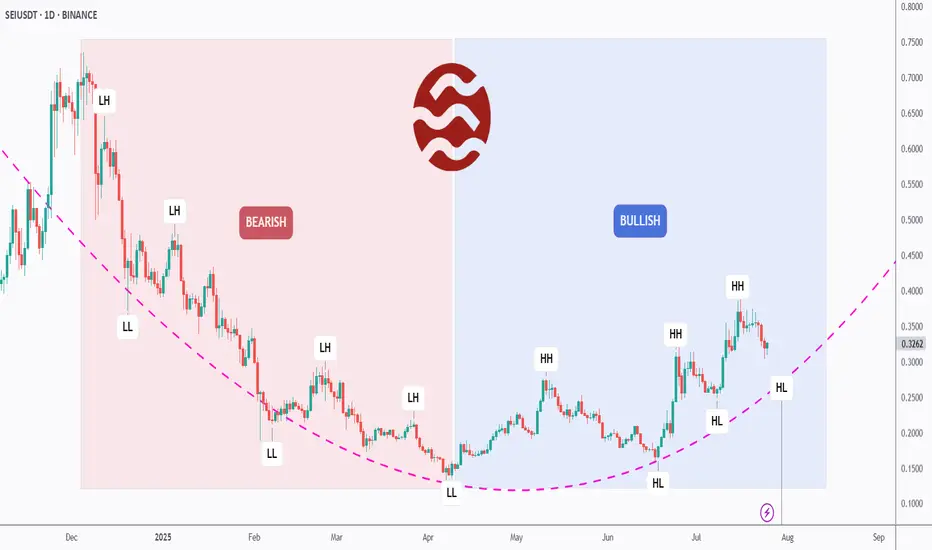
[Deep Dive] SEI – Edition 2: From Pain to Power: A Bull Cycle?SEIUSDT may have just flipped the script.
After months of consistent lower highs and lower lows, SEI has officially broken its bearish structure and is now printing clear higher highs (HH) and higher lows (HL) — a textbook sign of a trend reversal.
📉 Left Side: Bearish Breakdown
From late 2023
Related pairs
Sei · Technical Analysis · Beyond Trading —The Soul in the ChartThis is a nice chart. It is well structured. It is also basic and standard. You can know where a project is at based on the drawings (patterns) on the chart. When you look at hundreds of charts, for years, you can see the signature of the trading bots on each chart. Each exchange has a different set
SEI BUY LIMITHello friends🙌
📉According to the downward trend we had, you can see that a reversal pattern was formed at the specified support and buyers entered and raised the price, which caused the formation of an ascending channel.
👀Now that we are at the ceiling of the ascending channel, because there is a

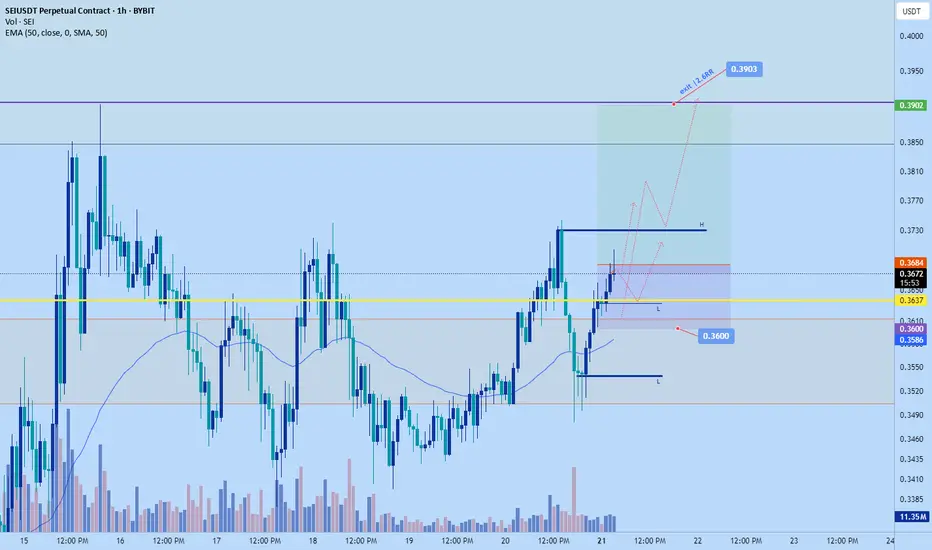
Seiusdt longWent long on sei just now. Aiming for $0.3903
Overall market is having a big bounce from weekend sell of including sei. I think the market will push and attempt to make a new HH based on my DTT analysis. Entry should have been a bit earlier but I just saw it.
SL: 0.36 or lower
Tp: 0.385-$0.39
I
SEIUSDT Rebounds from Key Support - Pump Loading?BINANCE:SEIUSDT Rebounds from Key Support - Pump Loading?
BINANCE:SEIUSDT just touched a major support level on the 4H chart and is now showing signs of a bullish reversal after breaking above the descending trendline. This setup looks similar to previous price actions where NYSE:SEI delivered

$SEI Bullish flag targets between $3.5 & $6.5 (X10 from here)Bullish flag, targets based on bullish flag and fibo

sei update Sei has pumped around 70% since i gave the trade and it's very close to reaching the wave B target Traders can book profits around 0.44$ this is 3 wave move to the upside then I expect a Wave c that will be five waves down movement pushing the coin to 0.07$ area

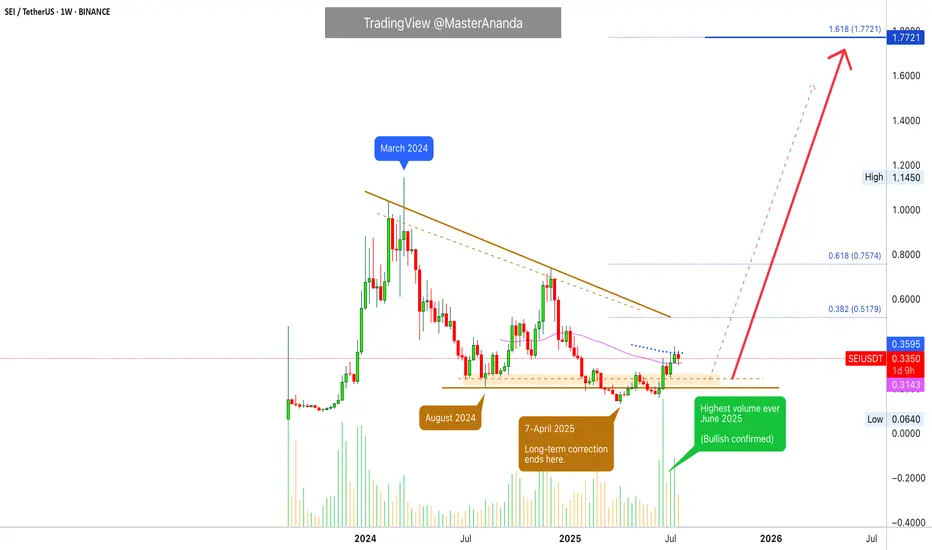
#SEIUSDT – Testing Resistance with Eyes on Breakout SEI is currently approaching a major descending trendline resistance after reclaiming the key weekly support zone around $0.20–$0.31. Price action is showing strength with a potential reversal setup building.
🔹 Key Technical Levels:
🔽 Support: $0.20–$0.31 (reclaimed zone)
📉 Resistance: Descending
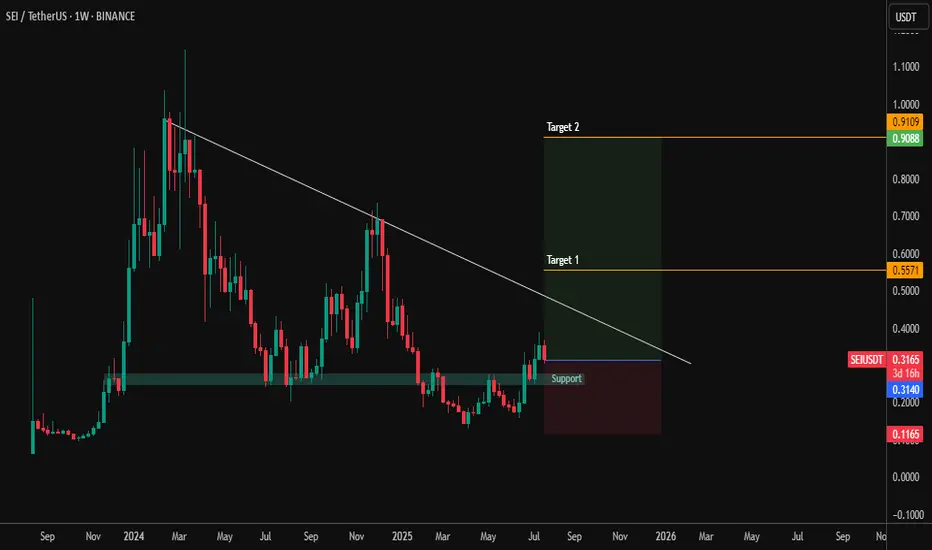
SEI — Breakout & D1 OB Target1. Support 0.33–0.36 holding
2. Entry after SR breakout
3. Target: D1 OB 0.47–0.54
4. Stop below 0.33

SEI | Trade-updateWe’ve almost reached our final profit target (orange). Once we get there, I’ll take out most of my margin position and let only a small portion run.
Same situation as with $ADA...
13 R/R since my call — you don’t need a strategy with an 80% win rate. A 30–50% win rate is more than enough if your ri

See all ideas
Summarizing what the indicators are suggesting.
Oscillators
Neutral
SellBuy
Strong sellStrong buy
Strong sellSellNeutralBuyStrong buy
Oscillators
Neutral
SellBuy
Strong sellStrong buy
Strong sellSellNeutralBuyStrong buy
Summary
Neutral
SellBuy
Strong sellStrong buy
Strong sellSellNeutralBuyStrong buy
Summary
Neutral
SellBuy
Strong sellStrong buy
Strong sellSellNeutralBuyStrong buy
Summary
Neutral
SellBuy
Strong sellStrong buy
Strong sellSellNeutralBuyStrong buy
Moving Averages
Neutral
SellBuy
Strong sellStrong buy
Strong sellSellNeutralBuyStrong buy
Moving Averages
Neutral
SellBuy
Strong sellStrong buy
Strong sellSellNeutralBuyStrong buy
Displays a symbol's price movements over previous years to identify recurring trends.
Frequently Asked Questions
The current price of SEI / TetherUS (SEI) is 0.3407 USDT — it has risen 0.60% in the past 24 hours. Try placing this info into the context by checking out what coins are also gaining and losing at the moment and seeing SEI price chart.
SEI / TetherUS price has fallen by −4.27% over the last week, its month performance shows a 20.01% increase, and as for the last year, SEI / TetherUS has decreased by −8.49%. See more dynamics on SEI price chart.
Keep track of coins' changes with our Crypto Coins Heatmap.
Keep track of coins' changes with our Crypto Coins Heatmap.
SEI / TetherUS (SEI) reached its highest price on Mar 16, 2024 — it amounted to 1.1450 USDT. Find more insights on the SEI price chart.
See the list of crypto gainers and choose what best fits your strategy.
See the list of crypto gainers and choose what best fits your strategy.
SEI / TetherUS (SEI) reached the lowest price of 0.0640 USDT on Aug 15, 2023. View more SEI / TetherUS dynamics on the price chart.
See the list of crypto losers to find unexpected opportunities.
See the list of crypto losers to find unexpected opportunities.
The safest choice when buying SEI is to go to a well-known crypto exchange. Some of the popular names are Binance, Coinbase, Kraken. But you'll have to find a reliable broker and create an account first. You can trade SEI right from TradingView charts — just choose a broker and connect to your account.
Crypto markets are famous for their volatility, so one should study all the available stats before adding crypto assets to their portfolio. Very often it's technical analysis that comes in handy. We prepared technical ratings for SEI / TetherUS (SEI): today its technical analysis shows the buy signal, and according to the 1 week rating SEI shows the buy signal. And you'd better dig deeper and study 1 month rating too — it's neutral. Find inspiration in SEI / TetherUS trading ideas and keep track of what's moving crypto markets with our crypto news feed.
SEI / TetherUS (SEI) is just as reliable as any other crypto asset — this corner of the world market is highly volatile. Today, for instance, SEI / TetherUS is estimated as 2.11% volatile. The only thing it means is that you must prepare and examine all available information before making a decision. And if you're not sure about SEI / TetherUS, you can find more inspiration in our curated watchlists.
You can discuss SEI / TetherUS (SEI) with other users in our public chats, Minds or in the comments to Ideas.