One Problem - No Solution - SEISEII just moved up and it create problem for new longs or short, they be like what to do buy or sell? Technically the moves are precendted by two ocassions, orange is the one where the moves top is to be get loaded and the moves down would get wrecked, the move it says need a orange move to get up and red says a straight top move
SEIUSDT.P trade ideas

SEI Rebound or Final Trap?Yello Paradisers, have you considered that this little bounce might be the last trap before a brutal selloff? SEIUSDT is giving us strong signals that most retail traders are missing and if you’re not reading the structure clearly, you’re walking straight into a setup designed to clean you out.
💎The recent price action shows a clear rejection from the $0.22 level, which has now confirmed itself as a strong resistance zone. What’s more concerning is that this resistance rejection comes right after the price broke down from an Ascending Broadening Wedge. This is not a random pattern it’s a classic formation that tends to attract breakout buyers and then punishes them with aggressive downside moves once the structure fails.
💎Currently, the market is drifting just below that resistance, attempting weak bounces. However, there is a clear lack of bullish momentum. If this weakness persists, the next stop is around the $0.16 region, where moderate support is likely to be tested.
💎If sellers get aggressive, that level might not hold, and we could head lower into the $0.13 area still not where true value lies. The major support zone sits far below, around the psychological $0.10 level, and that’s where the real high-probability bounce setup is likely to occur.
MyCryptoParadise
iFeel the success🌴

Sei long to $0.19 areaJust hopped into a long position on Sei. Am targeting $0.19 area to get roughly 3RR from the move given plays out.
Stop: $0.1824
Time sensitive.
Its relatively high but if btc continues to pump theres a good chance it will hit tp.

SEI | 1W range reclaim in progress.Holding above $0.20 (range low & demand zone) — expecting a move towards the mid-range ($0.48), where a stack of equal highs is waiting.
Lose $0.20 — invalidation, back to lower support.
Key idea: Range play, targeting liquidity at the mid-range. Macro resistance at $0.75 if breakout extends.
Accumulation still visible, bullish bias above range low.

SEI – Clear Invalidation, Going Long at 20cGoing long here on $SEI.
Invalidation is straightforward—shouldn’t see new lows from this point.
First target is 40c. If that breaks, we could see solid momentum follow through.
BINANCE:SEIUSDT 2x


SEI - SetupI don’t have an active position on NYSE:SEI right now — I’m already heavily allocated to my three other setups.
But this is a potential trade I’d consider if I weren’t in the market yet:
Tp1 + BE : at $0.28 — recent highs
Tp2: at $0.41 — target region
If you have any questions about my system or trade logic, drop them below — I read every comment 👇
And feel free to share your own analysis too — I’d love to see it!

$SEI Analysis📉 NYSE:SEI Analysis 📉
#SEI swept initial sell-side liquidity and bounced 🔄
Next watch: Tuesday’s low — want to see it taken and tapped into the 4H +OB for a long setup 🎯
If that +OB doesn’t hold, expect another liquidity sweep before the real bounce 🧹

SEI: Fully Locked#SEI showed a clean motive wave after its April low, followed by a corrective wave, forming a classic setup for a powerful third wave.
Holding above $0.130 keeps the idea valid, with $0.095 as final invalidation. Passing $0.275 confirms the pattern; $0.735 targets the ATH.

#SEI/USDT#SEI
The price is moving within a descending channel on the 1-hour frame, adhering well to it, and is heading for a strong breakout and retest.
We are experiencing a rebound from the lower boundary of the descending channel, which is support at 0.1840.
We are experiencing a downtrend on the RSI indicator, which is about to break and retest, supporting the upward trend.
We are in a trend of consolidation above the 100 Moving Average.
Entry price: 0.1927
First target: 0.1999
Second target: 0.2067
Third target: 0.2162

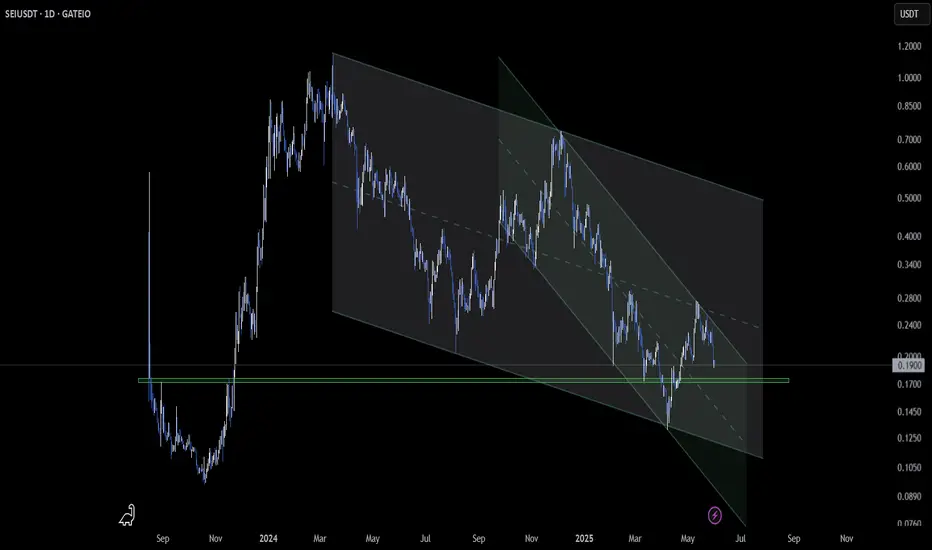
SEI – Descending Channel Test on Daily🟡 NYSE:SEI is consolidating within a descending channel on the daily timeframe. Price is approaching the key support zone between $0.1750 and $0.1650 — an area that needs to hold for any chance of a reversal.
👀 Keep this level on your radar as the next move could decide short-term momentum!
SEIHead and Shoulder Pattern is seen in the chart,
Breakout of Neckline will give a huge pump 🚀🚀🚀
Can grab some here 💰

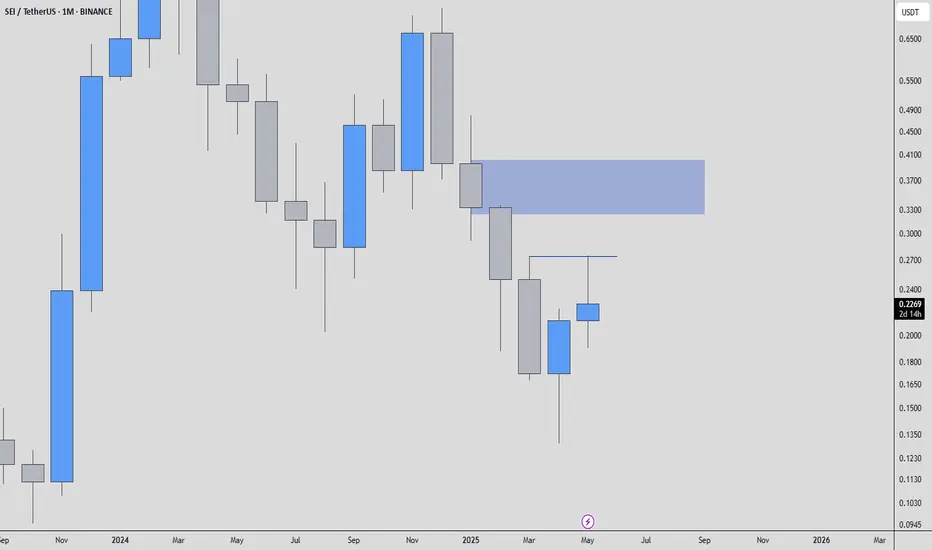
SEIUSDT - MEH!Hello everyone. I'm closely monitoring SEIUSDT, and I've observed significant activity in this asset: buyers have entered the market. This is a situation that demands close attention, as it carries the potential to shift the market's trajectory.
Our current focus is the blue box I've marked on the chart. This area currently presents itself as a resistance level. However, if buyers continue to strengthen and decisively break this blue box upwards, that's when a real opportunity could emerge. In such a scenario, following the breakout, I'll be looking for a retest on a low timeframe (LTF). If the price confirms this broken level as support, that will be a strong long position signal for me. This is one of those moments where the market is telling you, "I'm here."
When evaluating this scenario, I won't, of course, rely solely on price action. I'll be closely examining the volume footprint; understanding the true strength and intent of buyers is crucial. At the same time, I won't overlook CDV (Cumulative Delta Volume) divergences, as these can reveal hidden shifts in momentum. Sudden increases in volume, as always, act as a magnet for me; because, as you know, I only trade coins that are showing a sudden spike in volume. This is one of the secrets the market whispers to you.
However, as always, the market is two-sided, and we must remain flexible. If buyers fail to break this blue box and we see decisive downward breakouts on the daily timeframe, this could also present a potential scenario for a short attempt. Remember, the market can act independently of our expectations, and as a trader with one of the highest win rates, I always move according to the direction the market shows us.
We must also be vigilant against potential liquidity hunts at these levels. Price briefly pushing above the blue box and then rapidly falling back, or dipping below and then recovering, could be manipulations designed to shake out weaker hands. Failed breakouts or the regaining of lost levels will also provide us with valuable information.
Don't be surprised to see significant movements in SEIUSDT in the coming days. You might regret missing this setup, as most traders overlook these nuances at this level. Stay tuned, and let's decipher what the market is whispering together. You can trust my perspective.
📌I keep my charts clean and simple because I believe clarity leads to better decisions.
📌My approach is built on years of experience and a solid track record. I don’t claim to know it all but I’m confident in my ability to spot high-probability setups.
📌If you would like to learn how to use the heatmap, cumulative volume delta and volume footprint techniques that I use below to determine very accurate demand regions, you can send me a private message. I help anyone who wants it completely free of charge.
🔑I have a long list of my proven technique below:
🎯 ZENUSDT.P: Patience & Profitability | %230 Reaction from the Sniper Entry
🐶 DOGEUSDT.P: Next Move
🎨 RENDERUSDT.P: Opportunity of the Month
💎 ETHUSDT.P: Where to Retrace
🟢 BNBUSDT.P: Potential Surge
📊 BTC Dominance: Reaction Zone
🌊 WAVESUSDT.P: Demand Zone Potential
🟣 UNIUSDT.P: Long-Term Trade
🔵 XRPUSDT.P: Entry Zones
🔗 LINKUSDT.P: Follow The River
📈 BTCUSDT.P: Two Key Demand Zones
🟩 POLUSDT: Bullish Momentum
🌟 PENDLEUSDT.P: Where Opportunity Meets Precision
🔥 BTCUSDT.P: Liquidation of Highly Leveraged Longs
🌊 SOLUSDT.P: SOL's Dip - Your Opportunity
🐸 1000PEPEUSDT.P: Prime Bounce Zone Unlocked
🚀 ETHUSDT.P: Set to Explode - Don't Miss This Game Changer
🤖 IQUSDT: Smart Plan
⚡️ PONDUSDT: A Trade Not Taken Is Better Than a Losing One
💼 STMXUSDT: 2 Buying Areas
🐢 TURBOUSDT: Buy Zones and Buyer Presence
🌍 ICPUSDT.P: Massive Upside Potential | Check the Trade Update For Seeing Results
🟠 IDEXUSDT: Spot Buy Area | %26 Profit if You Trade with MSB
📌 USUALUSDT: Buyers Are Active + %70 Profit in Total
🌟 FORTHUSDT: Sniper Entry +%26 Reaction
🐳 QKCUSDT: Sniper Entry +%57 Reaction
📊 BTC.D: Retest of Key Area Highly Likely
📊 XNOUSDT %80 Reaction with a Simple Blue Box!
📊 BELUSDT Amazing %120 Reaction!
📊 Simple Red Box, Extraordinary Results
📊 TIAUSDT | Still No Buyers—Maintaining a Bearish Outlook
📊 OGNUSDT | One of Today’s Highest Volume Gainers – +32.44%
I stopped adding to the list because it's kinda tiring to add 5-10 charts in every move but you can check my profile and see that it goes on..
#SEI/USDT#SEI
The price is moving within a descending channel on the 1-hour frame, adhering well to it, and is heading for a strong breakout and retest.
We are seeing a bounce from the lower boundary of the descending channel, which is support at 0.2095.
We have a downtrend on the RSI indicator that is about to break and retest, supporting the upward trend.
We are looking for stability above the 100 Moving Average.
Entry price: 0.2249
First target: 0.2423
Second target: 0.2423
Third target: 0.2538

#SEI/USDT#SEI
The price is moving within a descending channel on the 1-hour frame, adhering well to it, and is on its way to breaking it strongly upwards and retesting it.
We are seeing a bounce from the lower boundary of the descending channel, which is support at 0.2170.
We have a downtrend on the RSI indicator that is about to break and retest, supporting the upward trend.
We are looking for stability above the 100 moving average.
Entry price: 0.2310
First target: 0.2372
Second target: 0.2446
Third target: 0.2563

SEIUSDTset up long trade perp 📈
🚨🚨🚨Disclaimer on Money Management for Trading in the Futures :
MarketFutures trading carries high risks and may result in the loss of your entire capital. Only use funds you can afford to lose, set risk limits, and understand the market and leverage. Diversification does not guarantee profits. Consult a financial advisor before trading. All decisions and losses are your sole responsibility.

Sei short to $0.2161Recently entered a short position on sei. Its still good enough to get decent RR.
Expecting the market to fall back down this weekly before any further pump. The pump yesterday likely was the top of the move for the week for now and market seems more likely now to fall back lower to retest $0.2072 area to hopefully find strong enough demand to get a more sustainable pump

Sei longJust now opened up a long position on Sei.
Targeting $0.2316 area
Stop: $0.2192 or lower
Roughly 2RR trade.
Trend is currently bearish on 4hr tf. Anticipating that this move will continue pushing to the upside flipping the 4hr tf bullish around $0.2316

SEIUSDT LONG 1DBullish Trend
Entry on Trendline
Expecting bullish trend will continue
AB==CD extra confirmation


SEI LIVE TRADEHello friends
Given the decline we had, we expect to experience another decline and we can open a trade in the direction of the trend with capital and risk management.
*Trade safely with us*

Sei long term.I expect it to reach 0.18 levels in the coming period, but before that, prices may approach 0.26 again. I expect the 3rd elliot wave to start between approximately 0.18 0.16 region.
* The purpose of my graphic drawings is purely educational.
* What i write here is not an investment advice. Please do your own research before investing in any asset.
* Never take my personal opinions as investment advice, you may lose your money.

SEIUSDT 1D AnalysisSEI ~ 1D Analysis
#SEI Buy gradually after retesting this support block with a short term target of at least 15%+ from here.
