SEI on a breakout path! We're seeing a strong move above previous resistance, heading towards ATH (all-time high). Price has broken out of a long-term descending trendline, found support, and is showing an impressive 173% gain.
Key levels to watch:
Support at $0.39
Resistance around $1.07
Momentum is picking up, and this could be a sign of more upside to come if we maintain above these levels. Bulls are definitely back in the game!
SEIUSDT trade ideas

TradeCityPro | SEI : Bullish Momentum with Key Resistance👋 Welcome to TradeCityPro!
In this analysis, we’ll evaluate the performance of SEI, a blockchain designed for decentralized futures trading. For a deeper understanding of the project, you can review its whitepaper.
⏳ Daily Timeframe: High Buying Volume and Uptrend
The daily chart shows a bullish trend supported by a trendline that has been tested three times. Currently, the price is well above this trendline. As long as the price remains above it, the overall trend will stay bullish.
📈 A breakout above $0.6944 could push the price to the next target of $0.9733. Beyond this resistance, SEI may aim for new All-Time Highs (ATH).
🔑 RSI entering the Overbought Zone (above 70) could trigger a sharp upward move.
🔽 In a bearish scenario, the price could correct to $0.5284 initially. A deeper correction might bring it down to the trendline and the $0.4006 support level.
📊 Currently, buying volume exceeds selling pressure, indicating that a correction is unlikely unless significant selling pressure enters the market.
⏳ 4-Hour Timeframe: Futures Triggers
In this timeframe, we’ll focus on identifying potential futures trading triggers:
🔼 For long positions, a breakout above the $0.6944 resistance, especially with increasing buying volume, would be ideal. If RSI also breaks the 50 level, the likelihood of overcoming this resistance increases.
📉 For short positions, a break below the $0.596 level could act as a trigger. However, personally, I avoid shorting as long as the price remains above the daily trendline.
📝 Final Thoughts
This analysis reflects our opinions and is not financial advice.
Share your thoughts in the comments, and don’t forget to share this analysis with your friends! ❤️

SEIUSDT Elliott Waves (Local Setup)Hello friends.
Please support my work by clicking the LIKE button👍(If you liked).
Everything on the chart.
Entry zone: market and lower
Target zone: 0.55 - 0.6
after first target reached move ur stop to breakeven
Stop: 0.31 (depending of ur risk).
ALWAYS follow ur RM
risk is justified
It's not financial advice.
DYOR!

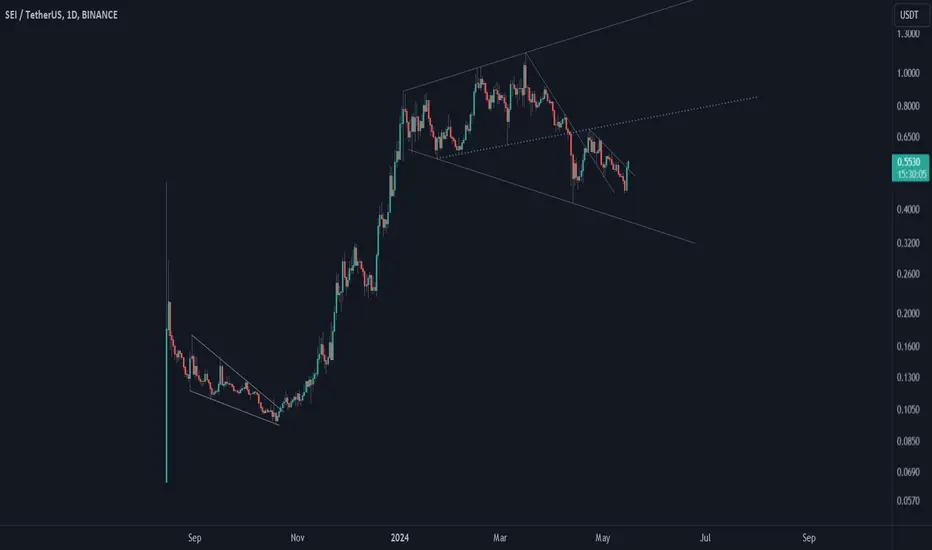
SEIThe SEI Network is a Cosmos-based Layer 1 blockchain that specializes in trading infrastructure for decentralized exchanges and marketplaces. SEI accelerates blockchain efficiency and block finality, reducing it to a mere 380 milliseconds through the twin-turbo consensus mechanism.
Anyway, it is clear that SEI has potential. Besides the beginning in which SEI was in a descending triangular shaped pattern, SEI went up pretty well—almost 1000%. Then correction started that seems unfolding in an inverted wedge pattern. SEI broke both the minor downtrend line going toward the wedge's middle line (blue). If SEI can break this line, reaching the wedge's upper line is possible. Let's see what happens.
#SEI/USDT#SEI
The price is moving in a descending channel on the 1-hour frame upwards and is expected to continue
We have a trend to stabilize above the moving average 100 again
We have a downtrend on the RSI indicator that supports the rise by breaking it upwards
We have a support area at the lower limit of the channel at a price of
0.6380
Entry price 0.6650
First target 0.6968
Second target 0.7247
Third target 0.7600

#sei 1dOn the 1-hour timeframe, the currency is forming a neutral triangle.
Considering the end of wave C, it is suitable for holding.


SEI is going HigherI am confident in trading this one. The price has broken the resistance at 0.6 and is consolidating above it. I believe it is heading higher as part of wave 3. By the end of this year, we might see SEI reach 1 dollar.

SEIUSDT Analysis: Key Levels to Watch for the Next Bullish MoveYello, Paradisers! Is SEIUSDT on the brink of a major major move , or should we brace for a retracement? Let’s dive into the latest technical setup, which could signal a big move ahead.
💎#SEIUSDT is currently positioned within a probable support zone, showing signs of potential bullish momentum with recent strong green candles. If this momentum holds, it could aim for a move above the key resistance level, presenting an opportunity for buyers.
💎If SEIUSDT sustains its upward momentum, it stands a solid chance of targeting levels above the critical resistance zone, especially following the recent break above $0.4197. Look for a retest of this level, where resistance could now act as support an ideal entry point with strong confirmation.
💎But what if the momentum slows? If SEI loses strength and falls below $0.4197, this would indicate waning bullish power, opening up potential for a bearish shift.
💎In this case, watch the lower demand zone at $0.3396, which has historically held firm for buyers. A rebound here could reinforce the bullish outlook, but a drop below $0.3396 could invalidate this setup, signaling a potential trend shift toward bearish sentiment.
As always, patience and discipline are crucial here. Wait for confirmation at critical levels before making any moves. Stay focused and trade smart, Paradisers. Only those who follow the cycles with discipline will reap the rewards in the long run!
MyCryptoParadise
iFeel the success🌴

SEI tends to growAccording to the analysis based on the Fibonacci sequence, BINANCE:SEIUSDT aims to reach 1.618 in the short term and 1.272 in the medium term. Today's token unlocking is expected to have a positive impact on the market value of the asset. My observations of the blockchain data indicate that investment funds are approaching the critical threshold of owning an issue of the asset. I expect the 0.54-0.56 area in the near term.
Best wishes, Horban Brothers!

#SEI / USDT and #SUI / USDT Similarity Analysis:#SEI / USDT and #SUI / USDT Similarity Analysis:
Both NYSE:SEI and SUI show a similar upward trajectory, respecting ascending channels:
$SEI/USDT:
Current price 0.6707 within a steady ascending channel.
Potential breakout towards 1.0000+ if momentum persists.
Strong support around 0.6000, ideal for re-entry on pullbacks.
$SUI/USDT:
Current price 3.3699, already broke above its channel.
Consolidation or pullback towards 3.0000 could provide a strong re-entry. Next target is 4.0000+, mirroring SEI's potential.
Both pairs are exhibiting bullish structures with strong ascending channels, showing potential for higher highs. SUI is slightly ahead, having already broken out, while SEI is in a pre-breakout stage, providing an opportunity to anticipate similar movement.

There is a high probability that the SEI will go up to 0.75~0.87BINANCE:SEIUSDT
There are three reasons why I thought SEI would rise. First of all, it broke the resistance line of 0.58$. The second is that there was not much response to the adjustment of BTC the previous day compared to other altcoins. The third is that the bullish weekly and daily cycles continue.

High Risk-to-Reward Setup on 4H Chart SEITrade setup based on supply/demand and order block
Disclaimer: This is not financial advice. Always conduct your own research before trading.

SEI/USDT to $3.08sei ran up to $1.13 came back to 0.618 FIB (golden pocket) in a fallen wedge .
Technical target of this pattern is $3.08
TVL (total value locked) in SEI is at ATH , I see SEI repeating what SUI did a few weeks ago; I pasted to SUI pump and put it over SEI chart and as you see its kinda similar.
SEI showed incredible strength today while BTC dumped
I wont be suprised if we reach a $1 SEI by jan 2025

SEIUSDT LONG ENTRIESSEIUSDT Is in bullish as it has done BOS Marked X on the chart. Most importantly it has created trendline liquidity above demand zone. When price will come down to grab that liquidity then we will enter long from DEMAND ZONE.

#SEI/USDT / Ready to go up#SEI
The price is moving in a descending channel on the 12-hour frame and sticking to it well
We have a bounce from the lower limit of the descending channel, this support is at 0.3400
We have a downtrend, the RSI indicator is about to break, which supports the rise
We have a trend to stabilize above the moving average 100
Entry price 0.5030
First target 0.5481
Second target 0.6127
Third target 0.6950

SEI is still bullish (8H)This analysis is an update of the analysis you see in the "Related publications" section
In the previous analysis, we said that SEI can go up from the range of the green circle. The SEI rose without pullback into this range but later corrected to the green range and then pumped.
Now we have specified the rebuy zone. If you haven't bought, you can enter a position in the rebuy zone.
The target is a red box
Closing a daily candle below the invalidation level will violate this analysis
For risk management, please don't forget stop loss and capital management
Comment if you have any questions
Thank You

Can SEIUSDT Maintain Its Bullish Momentum?
SEIUSDT is demonstrating a strong bullish trend, characterized by consistent higher highs and higher lows. Currently, the price is testing the resistance at $0.63 , a critical level for determining the next move.
EMA Ribbon: The ribbon is bullish, supporting the upward momentum. A pullback to the previous BOS level at $0.5208 could provide an optimal entry point for long positions, as it aligns with the ribbon's dynamic support.
Resistance Break: If the price successfully breaks and holds above $0.63 , the next potential target is the upper resistance near $0.97 .
TSI Indicator: A previous bullish divergence on the TSI hinted at this upward move, and the indicator now sits comfortably above the zero level, reinforcing the bullish outlook.
Signal Builder: Recent signals from the indicator have been bullish, confirming alignment with the current price action.
Should SEIUSDT surpass $0.63 , it opens the door for a rally toward $0.97 , provided the bullish structure remains intact. However, a retracement to $0.5208 could offer a strategic re-entry before continuing the uptrend.
👨🏻💻💭 Will SEIUSDT break through resistance and hit $0.97, or is a retracement to $0.5208 more likely? Share your thoughts below!
_________________________________________________________________
The information and publications within the 3Commas TradingView account are not meant to be and do not constitute financial, investment, trading, or other types of advice or recommendations supplied or endorsed by 3Commas and any of the parties acting on behalf of 3Commas, including its employees, contractors, ambassadors, etc.

$SEIUSDT ready for flybased on waves I will guaranty you it will rise 75%. i would not miss this great setup.Entry and exit prices are on the chart.
If you agree, pls hit the support.
thanks

SEIUSDT Bullish Flag Pattern!SEIUSDT Technical analyssi update
SEIUSDT is breaking out of a bullish flag pattern on the daily chart with high volume. We can expect a continuation of the bullish trend from the current level. It took 50 days to form the bullish flag pattern, and the price is trading above the 100 and 200 EMAs, providing additional confirmation of the uptrend. A sustained breakout above this pattern could lead to further gains.
Regards
Hexa


#SEI/USDT#SEI
The price is moving in a descending channel on the 1-hour frame
And it is sticking to it well
We have a bounce from the lower limit of the descending channel and we are now touching this support at 0.4400
We have a downtrend on the RSI indicator that is about to be broken, which supports the rise
We have a trend to stabilize above the moving average 100
Entry price 0.4470
First target 0.4670
Second target 0.4880
Third target 0.5160

SEEMS CRYSTAL CLEARSEIUSDT SEEMS BULLISH
It looks like SEIUSDT is showing some bullish signals! According to recent technical analysis, SEIUSDT is forming a bullish flag pattern on the daily chart, which often indicates a continuation of the upward trend2. Additionally, the price is trading above key moving averages, and the Relative Strength Index (RSI) is showing positive momentum
