SEI/USDT Poised for a Major Breakout – Will It Surge Toward $0.7📊 Full Technical Analysis:
The SEI/USDT daily chart reveals a compelling setup with strong breakout potential. Here's a detailed breakdown:
🔍 Pattern & Key Structure:
Descending Trendline Breakout: SEI has successfully broken out of a long-term descending trendline that has suppressed price action since December 2024 — a strong early signal of a bullish reversal.
Bullish Retest in Progress: The price is currently retesting the breakout area, aligning with a historical demand zone and Fibonacci retracement levels of 0.5 ($0.2468) and 0.618 ($0.2259).
Previous Consolidation Zone: SEI previously moved sideways within a yellow box between $0.18 – $0.25. The breakout from this zone adds bullish confirmation.
🟢 Bullish Scenario:
If SEI holds above the key demand zone ($0.2259 – $0.2468), a strong rally could follow, targeting these Fibonacci resistance levels:
🔸 $0.3068
🔸 $0.3367
🔸 $0.4696
🔸 $0.5438
🔸 $0.6086
🔸 $0.6500
🔸 Final target: $0.7013 (major resistance)
This scenario is validated by a higher low formation and a continuation of the current uptrend, especially if backed by strong volume.
🔴 Bearish Scenario:
If the price breaks below the demand zone ($0.2259 – $0.2468), further downside may be expected, with potential support levels at:
🔻 0.786 Fibonacci at $0.1961
🔻 Historical support zones at $0.18 and $0.13
A bearish breakdown would invalidate the bullish structure and suggest sellers remain in control.
📐 Pattern Summary:
Pattern Type: Descending Trendline Breakout + Bullish Retest
Validation: Retest aligned with Fibonacci & prior consolidation
Bias: Bullish, as long as the price holds above $0.2259
📝 Conclusion:
SEI/USDT is showing early signs of a bullish reversal after a breakout from its long-term downtrend. A continuation toward higher Fibonacci levels is likely if the price holds the key demand zone. Traders should watch for bullish confirmation signals near support before entering.
#SEI #SEIUSDT #CryptoBreakout #BullishSetup #TechnicalAnalysis #FibonacciTrading #CryptoSignals #AltcoinSeason #ChartPattern #CryptoTA
SEIUSDT trade ideas

sei long again to $0.3Recently went long on sei, targeted the 4hr HH point. corrected a bit and went long again, this time targeting $0.3
Time sensitive. Still one can get Like 2RR + from it I think
stop could be tigher as well to around $0.2780

Sei long to $0.2845Sei long to $0.2845. Just went long.
Currently attempting to flip bullish on 1hr tf and will also likely push to flip bullish on 4hr tf as well based on my analysis.
Roughly 3RR setup

Important volume profile area: 0.2392
Hello, traders.
If you "follow", you can always get the latest information quickly.
Have a nice day today.
-------------------------------------
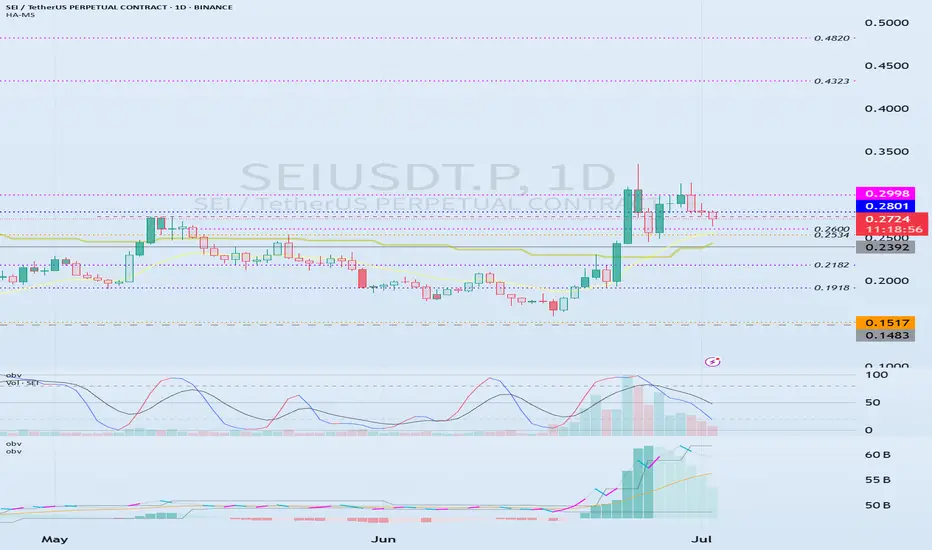
(SEIUSDT.P 1M chart)
I wonder what the 1M chart means on the futures chart, but if you know the current big picture trend, I think you can trade according to your main and secondary positions.
Currently, the volume profile section is formed at 0.2392 on the 1M chart, so it is expected that the major trend will be determined based on this point.
In other words, if the price is maintained above 0.2392, I think it is highly likely to turn into an uptrend.
-
(1W chart)
Currently, on the 1W chart, we are checking for support near the 0.2750 point, which is the StochRSI 80 indicator point.
The StochRSI 80 indicator is one of the indicators that indicates the high point section.
Therefore, if it is supported near the StochRSI 80 indicator, it is highly likely to rise.
On the other hand, if it is not supported, it is important to check for support because it corresponds to the resistance point.
Once the rise begins, it is basically likely to rise until it meets the HA-High indicator.
The HA-High indicator is currently formed at 0.7406.
However, when rising, there is a possibility of receiving resistance near the area where the arrow is pointing, so you should think about a countermeasure.
-
(1D chart)
In order to rise, the price must rise above the 0.2801-0.2998 range and maintain it.
If not, there is a possibility of falling until the HA-Low indicator is met.
However, since an important volume profile range is formed at the 0.2392 range, whether there is support near this area is an important issue.
Therefore, if it falls below 0.2392, it is recommended to stop trading and check the situation if possible.
If it rises above 0.2998, it seems likely to surge to the 0.4323-0.4820 range because the resistance range is weak.
-
Thank you for reading to the end.
I hope you have a successful trade.
--------------------------------------------------
- Here is an explanation of the big picture.
(3-year bull market, 1-year bear market pattern)
I will explain more details when the bear market starts.
------------------------------------------------------

SEI The next big Move#SEI
The price is moving within a descending channel on the 1-hour frame and is expected to break and continue upward.
We have a trend to stabilize above the 100 moving average once again.
We have a downtrend on the RSI indicator that supports the upward break.
We have a support area at the lower boundary of the channel at 0.2750, acting as strong support from which the price can rebound.
We have a major support area in green that pushed the price upward at 0.2600.
Entry price: 0.2813
First target: 0.2879
Second target: 0.2970
Third target: 0.3080
To manage risk, don't forget stop loss and capital management.
When you reach the first target, save some profits and then change your stop order to an entry order.
For inquiries, please comment.
Thank you.

Sei long to $0.3062Recently entered long on sei
Targetting the daily high area around $0.3062
Stop: 0.2788

Sei - Trade✅ Entry at the green trend reversal zone
✅ 50% Fibonacci level hit perfectly
✅ Expected reaction – impulsive move toward TP1
Our first take profit at the trend reversal zone at $0.29 has been reached, and the stop-loss has been moved to break-even.
TP2 is set at the 100% correction level at $0.336 — I’ll realize most of my profits there and let a small amount run from that point on.

Looking for reversal trades usimng the 6H CPRLooking for reversal trades usimng the 6H CPR combining it with using the PAR momentum indicator.

$SEI READY FOR NEXT MAJOR RALLY +80%Whats up traders!?! If i could ask you to LIKE if you found this content worth viewing and could provide value to others then smash that LIKE button and if you want to FOLLOW that would be awesome too! Thanks
A simple analysis on NYSE:SEI
The NYSE:SEI team is cooking and when i say cooking i mean building heavily thats why we saw a massive price swing up last week on NYSE:SEI which i publicly shared on X and also exclusively shared the entry, target and stoploss to the massive NYSE:SEI pump in my private tg.
Resistance
$0.3060
$0.3354
$0.3500
$0.4273
$0.4743
Your Entry is NOW below $0.30 cents
Highly likely we go to almost $0.50 cents once we break $0.30 cents as there is an inverse head and shoulders formation that has a measured move to at least $0.42 cents
Make sure to trade responsibly and always use proper risk management. If you need help with that contact e on tradingview and i will be more then happy to help!
Thanks, Liquidmex


SEI superbSEI has been superb with our indicator. The Fbuy triggered at the right moment and we can see how the asset flew for few days and giving a sell print at the trend exhaustion. Now the asset has again reached our sell line and it's hovering there after we got a right fbuy print.
any momentum above our sell line will have more targets like 0.31 and above.
For indicator access you can contact me
D Y O R

Is SEI PA rigged?The PA is not rigged but just the TPO's pull did it, ideally, if bTC goes up the same move to top shall be done in the way, or full retracement can be seen

SEI - Trade setupWith the recent break of the last daily high at $0.27, we've activated a new daily bullish structure with target regions up to $0.39.
I'm opening new long positions here at the B-C correction level, at each retracement level.
My first order just got triggered on the 0.5 retracement level, once i hit 2 R/R i will set my trade to break-even.

SEI Just Broke Out - Massive Rally Incoming?SEIUSDT Technical analysis update
SEIUSDT is testing a long-term descending trendline, which has acted as strong resistance on multiple occasions. Price has now broken above this level with strong volume, signaling a potential trend reversal. And price trading above 100 and 200 EMA, in the coming trading days, we can see a strong bullish move in SEI
NYSE:SEI

SEIUSDT Forming Falling WedgeSEIUSDT has recently confirmed a falling wedge breakout, a strong bullish reversal pattern that often marks the end of a downtrend and the start of an impulsive move upward. The breakout has occurred with solid momentum, and volume is supportive—indicating that buyers are stepping in with conviction. This technical formation suggests a potential price surge ranging between 60% to 70%, aligning with historical projections from similar wedge breakouts.
As shown in the daily chart, SEIUSDT has broken above the wedge resistance and followed up with strong bullish candles. This surge confirms growing demand and positive sentiment in the market. Notably, the immediate targets are marked at $0.34 and $0.37, with upside potential of over 83% from the breakout point, offering attractive risk-reward for traders and swing investors.
Fundamentally, SEI is gaining traction within the decentralized ecosystem. Its focus on high-performance blockchain scalability and its growing developer community is drawing significant attention. Social media chatter and on-chain data also reflect increasing accumulation from retail and mid-tier wallets. Such organic traction often translates into sustainable price movements, especially when paired with strong technical setups like this.
Overall, SEIUSDT is shaping up as a high-potential altcoin play. With technical confirmation, investor interest, and bullish sentiment across the board, this breakout could be just the beginning of a larger trend. Traders should keep an eye on pullbacks for potential entries and watch for continuation above local resistance levels.
✅ Show your support by hitting the like button and
✅ Leaving a comment below! (What is You opinion about this Coin)
Your feedback and engagement keep me inspired to share more insightful market analysis with you!

#SEI/USDT#SEI
The price is moving within a descending channel on the 1-hour frame, adhering well to it, and is on its way to breaking it strongly upwards and retesting it.
We are seeing a rebound from the lower boundary of the descending channel, which is support at 0.2942.
We have a downtrend on the RSI indicator that is about to break and retest, which supports the upward trend.
We are looking for stability above the 100 moving average.
Entry price: 0.3062
First target: 0.3151
Second target: 0.3290
Third target: 0.3421

#SEI/USDT#SEI
The price is moving within a descending channel on the 1-hour frame and is expected to break and continue upward.
We have a trend to stabilize above the 100 moving average once again.
We have a downtrend on the RSI indicator, which supports the upward move by breaking it upward.
We have a support area at the lower limit of the channel at 0.2696, acting as strong support from which the price can rebound.
Entry price: 0.2790
First target: 0.2894
Second target: 0.3030
Third target: 0.3177

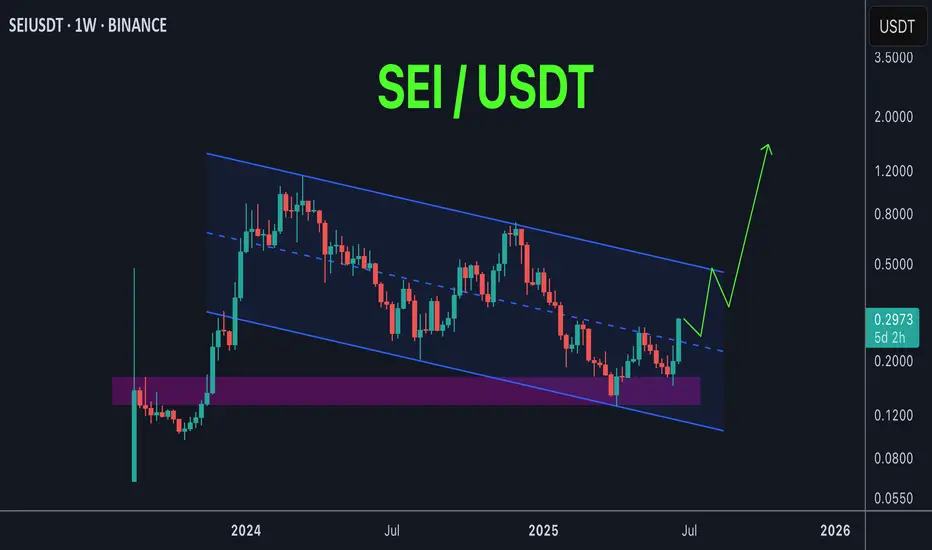
SEI possible playout SEI / USDT
Price is trading inside big descending channel
Next stop : price will hit the upper trendline of the channel and if managed to breakout this resistance it will skyrocket maybe to new ATH
Keep an eye on it …
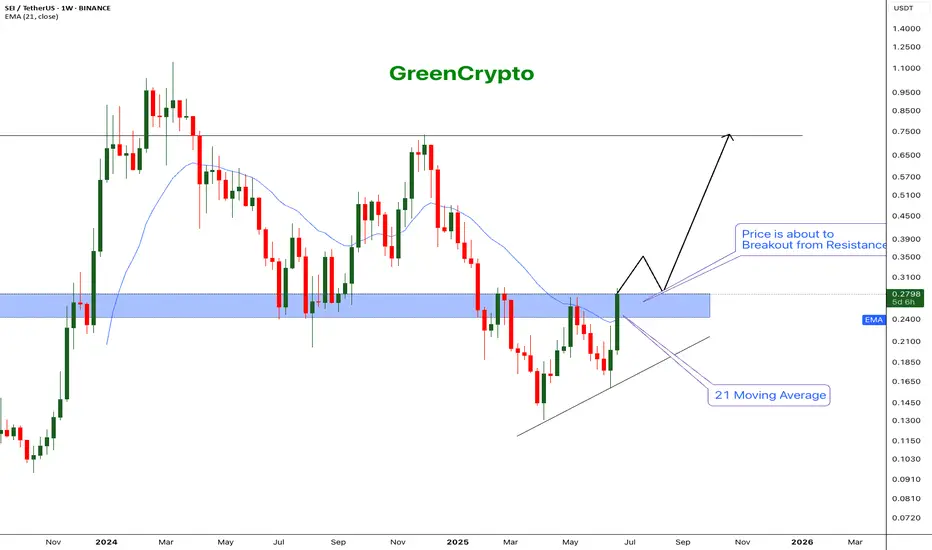
SEI - The next big runner$BINANCE:SEI/USDT (1W CHART) Technical Analysis Update
SEI is currently trading at $0.2785 and showing overall bullish sentiment
Price successfully breached the 21 EMA and now price is trading near one of the major resistance zone.
If the weekly candles closes above the resistance then we can expect further bullish momentum.
I'm expecting the price to easily break the resistance and hit the next major resistanc e around 0.75
Entry: After close above resistance (0.285)
StopLoss: 0.18
TakeProfit 1: 0.3506
TakeProfit 2: 0.4962
TakeProfit 3: 0.7367
Don't forget to keep stoploss!
Follow our TradingView account for more technical analysis updates. | Like, share, and comment your thoughts.
Cheers
GreenCrypto
SEI SELL SETUP , Sold From $0.2860SEI SELL SETUP
Currently $0.2860
Sold From $0.2860
(Trading plan If SEI go up to $0.30
will add more shorts)
Expecting target $0.2720 OR DOWN
In the event of an early exit,
this analysis will be updated.
Its not a Financial advice

$SEI Testing Critical Resistance After BreakoutNYSE:SEI has finally broken above the long-standing resistance trendline, a strong sign of bullish momentum building up.
Right now, it’s facing some pressure at the marked resistance zone. If bulls manage to flip this area into support, we could see the next leg up. But if it gets rejected here, a short pullback or retest isn’t off the table.
Let the level decide the next move — no need to chase.
DYOR, NFA

Phemex Analysis #92: Pro Tips for Trading Sei (SEI) Sei ( PHEMEX:SEIUSDT.P ) Network’s recent advancements underscore its commitment to extreme scalability, Ethereum Virtual Machine (EVM) compatibility, and streamlined user experience, all backed by strong institutional support and rapid adoption.
The recent launch of Sei V2 marks a major milestone, enhancing Sei’s performance dramatically. With this upgrade, the network now processes an impressive 5 gigagas per second, equating to approximately 200,000 transactions per second (TPS) with sub-400 millisecond finality. Such metrics position Sei among the fastest EVM-compatible blockchains globally, facilitating groundbreaking real-time applications in DeFi, AI, and trading. Improvements like the SeiDB storage layer further boost efficiency by accelerating node syncing and reducing state bloat.
Institutionally, Sei is experiencing remarkable momentum. Recently, Canary Capital filed with the US SEC for the first-ever SEI-based Exchange Traded Fund (ETF), offering regulated access to staked SEI and on-chain yields. Additionally, prominent investors like Circle Ventures, Multicoin Capital, and Delphi Digital strongly validate Sei’s potential as a high-performance Layer-1 blockchain.
These significant developments—technical excellence, streamlined ecosystem, and strong institutional backing—position Sei Network as a top-tier contender in the blockchain industry.
Possible Scenarios
1. Bullish Continuation (Further Uptrend)
Over the past two days, SEI’s price surged by more than 45%, indicating robust bullish momentum. The immediate resistance at $0.292 appears attainable if bullish strength persists.
However, traders should anticipate significant resistance at higher levels, notably at $0.43 and $0.50. Approaching these key levels, market volatility could increase substantially.
Pro Tips:
Profit-Taking: Strategically take partial profits as SEI approaches the critical resistance zones near $0.43 and subsequently $0.50.
Risk Management: Implement protective stop-loss orders just below recent support zones, such as $0.255, to manage unexpected reversals.
2. Rejection at $0.292 (Potential Retracement)
Considering the sharp recent gains in a relatively uncertain market environment, a rejection at the $0.292 resistance is plausible. Should this occur, SEI might seek support at lower levels, primarily around $0.19 and $0.158, before stabilizing.
Pro Tips:
Buy-the-Dip Strategy: Monitor the lower support levels ($0.19 and $0.158) closely. These areas might offer favorable opportunities for accumulating SEI at discounted valuations.
Volume Confirmation: Keep an eye on trading volume during pullbacks; lower volume would indicate a potentially healthy correction rather than a sustained bearish move.
3. Breakthrough $0.292 but Retrace to Accumulate Momentum (Consolidation Scenario)
Another scenario involves SEI initially breaking above $0.292, then experiencing mild pullbacks toward approximately $0.255 to consolidate momentum. In this pattern, price may gradually climb higher, with smaller upward moves interspersed by brief retracements.
Pro Tips:
Long Grid Bots: Leverage grid trading bots effectively to capture profits from the smaller price fluctuations typical in this scenario. Start long-grid bots around the support level at $0.255 and target modest incremental gains.
Patience and Adaptability: Maintain discipline, patiently letting positions unfold while continuously managing your exposure through proper stop-loss placements and profit-taking strategies.
Conclusion
Sei Network’s robust technical performance, institutional backing, and recent bullish price action provide traders with several actionable scenarios. By carefully observing the outlined resistance and support levels and employing disciplined trading strategies—including timely profit-taking, grid bot deployment, and vigilant risk management—traders can confidently navigate SEI’s volatility to optimize returns effectively.
🔥 Tips:
Armed Your Trading Arsenal with advanced tools like multiple watchlists, basket orders, and real-time strategy adjustments at Phemex. Our USDT-based scaled orders give you precise control over your risk, while iceberg orders provide stealthy execution.
Disclaimer: This is NOT financial or investment advice. Please conduct your own research (DYOR). Phemex is not responsible, directly or indirectly, for any damage or loss incurred or claimed to be caused by or in association with the use of or reliance on any content, goods, or services mentioned in this article.
