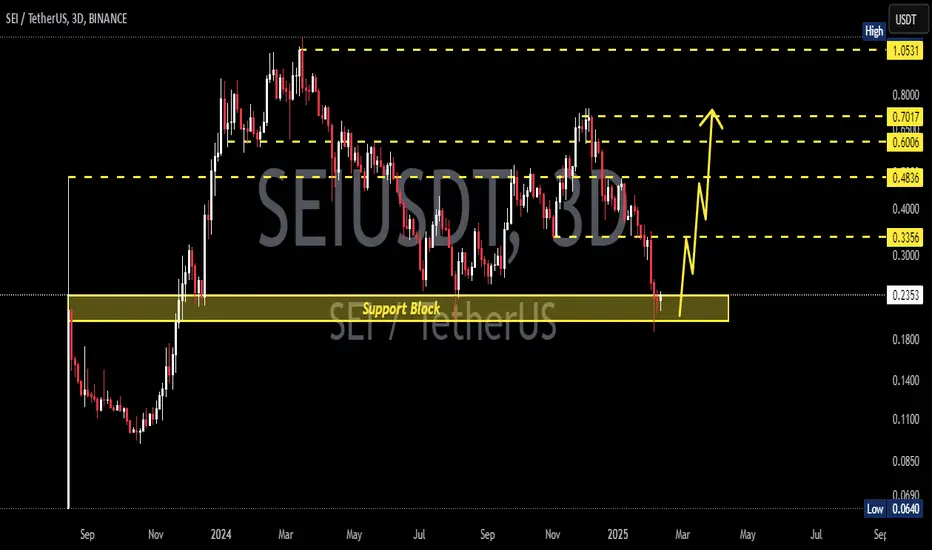
Sei ABC Correction & 984% Target (2025 ATH Will Be Higher)Based on the MKRUSDT Elliott Wave Theory publication , we know that a bullish impulse comes after a correction.
Here we have SEIUSDT with a classic ABC correction after a 5 up-wave pattern (bullish impulse). After the ABC a new bullish impulse will develop which means five up-waves.
This is very interesting because we are looking at a bottom catch.
SEIUSDT bottomed in February 2025 as a technical double bottom, vs the August 2024 low, and a higher low, vs the October 2023 low.
This is all good but why is this important?
Once we hit bottom, there is no place left to go but upwards.
SEIUSDT just hit bottom and this bottom is very likely to be followed by the strongest bullish wave ever for this project because this is a new project.
The target on the chart is mildly strong but I still feel that I am being conservative here. Since this pair wasn't around in 2021, we don't know its potential for 2025. The only bullish wave we have is that one from late 2023 through early 2024.
So we have 984% potential being conservative, but the truth is that SEIUSDT is likely to peak much higher by the time the bull-market ends. It will be wild. It will be amazing.
Thanks a lot for your continued support.
Namaste.
SEIUSDT trade ideas

Sei short back to $0.2249Just now hopped into a sei short. I anticipate it will correlate with bitcoin as bitcoin is likely to fall back to $94000 and if that happens I think sei will also continue to fall.
$0.2249 sees like a good area to exit due to some support in that area.
Time sensitive

SEIUSDT 3DSEI ~ 3D Analysis
#SEI Buy from here if you still have a Conviction on this coin with a minimum target of 20%++.
$sei short to $0.22-0.21Just now opened a short on $sei.
I attempted a long on it today but bulls are finding it difficult to break back up higher. And the trend is still down overall so am just gonna short it a bit until that changes.

SEI | ALTCOINS | +150% Bounce Zone TARGETSEI is an altcoin that bounces well from support zones and therefore excellent to trade as a swing trade.
You can confirm that SEI bounces from support zones by taking a look at this post I made in August last year, just before SEI increased 232%:
For the short term, there seems to be no clear indication of a turnaround, but the good news is that a better buy zone is approaching for the next impulse wave up - which could be a really big swing.
_____________________
BINANCE:SEIUSDT

#SEI/USDT#SEI
The price is moving in a descending channel on the 1-hour frame and is adhering to it well and is heading to break it strongly upwards and retest it
We have a bounce from the lower limit of the descending channel, this support is at a price of 0.2260
We have a downtrend on the RSI indicator that is about to be broken and retested, which supports the rise
We have a trend to stabilize above the moving average 100
Entry price 0.2362
First target 0.2555
Second target 0.2727
Third target 0.2900

SEII see bullish move on 15mtf on SEI everything is mentioned on charts lets see how market move is it in our side or not 1:3RR

SEI longSEI is at support, and at strong support.. so it looks like a good bounce. If we're still in a bull market, it will shoot up a lot.

$sei to $0.2828I just recently open a long position on Sei.
Its breakout out now. I anticipate it will pump back up to $0.2828 area
Time sensitive

SEI is going to everyone looks like i hope not, but ...IT's clear this crypto is going to M very similar to WIF chart and that went and just liquidated everyone, this TOKEN seems as thought it was made just to liquidate not bullish on this token, i hope it doesn't but it's obvious what this token was made for.
Seen this play out too many time this will not hold and will fall out and take out all newbies that longed it like myself hahaha should of cut it ages ago

SEI Ready to Break Out? Key Levels to Watch!
SEI is showing promising signs after a solid pullback, currently down 60% from its peak. Since early December, the price has remained below the descending trendline. A strong entry opportunity could arise once it breaks above this trendline resistance. Key targets are outlined on the chart.

Buying Spot CMP Target $1SEI
Sei
SEI
#71
207K
$0.3398
3.36% (1d)
Market cap
$1.5B
3.36%
Volume (24h)
$111.57M
19.92%
FDV
$3.39B
Vol/Mkt Cap (24h)
7.45%
Total supply
10B SEI
Max. supply
--
Circulating supply
4.43B SEI

#SEI/USDT Ready to launch upwards#SEI
The price is moving in a descending channel on the 1-hour frame and is adhering to it well and is heading to break it strongly upwards
We have a bounce from the lower limit of the descending channel, this support is at a price of 0.3000
We have a downtrend on the RSI indicator that is about to be broken, which supports the rise
We have a trend to stabilize above the moving average 100
Entry price 0.3040
First target 0.3200
Second target 0.3400
Third target 0.3617

$sei continue crash tomorrow $0.27NYSE:SEI is the next pair am planning to short along with bitcoin short that I took earlier, See most recent idea.
Target: $0.285 - $0.27 Just a matter of timing.
So NYSE:SEI and #btc only until either play out then I look for next setup. Just to keep correlation risk to a minimum.
NYSE:SEI looks very very very likely to fall to $0.2850. Prior month support is in that area.
Will update when I take my entry below

SEI/USDT Chart Analysis 1D#SEI/USDT is currently trading within a falling wedge formation on the 1 days timeframe, a classic bullish reversal pattern. This pattern, coupled with a liquidity sweep at the lower boundary, has already shaken out impatient traders. But remember, no move is confirmed until we see a decisive breakout. A decisive move above key resistance is needed to confirm the shift in momentum. If the trendline of the pattern breaks, we can prepare for a bullish trade and we can witness a strong upward movement.
Targets🎯
🎯 0.3717
🎯 0.45
🎯 0.5094
🎯 0.66
🎯 0.7369

#SEI Ready for a Bullish Rally or Not? Key Levels to Watch Yello, Paradisers! Is #SEIUSDT gearing up for a major breakout, or are we in for another leg down? Let’s break down the #SEI setup:
💎#SEI is currently trading within a falling wedge formation on the 8-hour timeframe, a classic bullish reversal pattern. This pattern, coupled with a liquidity sweep at the lower boundary, has already shaken out impatient traders. But remember, no move is confirmed until we see a decisive breakout. A decisive move above key resistance is needed to confirm the shift in momentum.
💎The major resistance zone to watch is $0.479. If #SEI manages to break above this level with strong volume, we could see a sharp rally towards the $0.65–$0.70 range, where significant selling pressure may come into play. However, failing to break above resistance could lead to another retest of lower levels before any bullish continuation.
💎On the downside, #SEI is sitting on a strong support zone around $0.2800. Buyers have consistently stepped in at this level, reinforcing its importance. If this support holds, we can expect a bounce and a potential attempt to break out of the wedge. The next line of defense for the #SEI is at the demand zone at $0.205 if the above support fails.
💎However, a candle closing below the demand zone at $0.2053 would invalidate the bullish scenario, exposing #SEI to a further drop towards $0.15 or even lower.
Stay focused, patient, and disciplined, Paradisers🥂
MyCryptoParadise
iFeel the success🌴

Sei long to $0.3456Just recently entered NYSE:SEI long
I anticipate that the market will push back up anytime now.
Its quite low on the daily tf and seller exhaustion is visible as bulls are starting to break back above resistance.
Looking to start scaling out at $0.3305 though at least 50% just incase strong supply comes back in the market there.
It seems to me its just a matter of good stop placement right now, I feel confident that it will play out.

SEI’s Comeback: Time to Ride the Wave to ATHs!Giving SEI a second chance—why?
It’s made a higher high and taken out the previous swing highs before the massive drop to 20c. That’s enough for me to start scaling back in.
I was a bit early before, buying at the same price in October, but now it’s looking much healthier.
I think this time it breaks ATHs. So, start jumping in to enjoy some nice gains!
BINANCE:SEIUSDT

high tf longi expect sei to do a liquidity grap below last higher low on the daily timeframe and that could be a really golden position for a big 3x up to 1$

SEI/USDT | 4-Hour Reversal SetupThis SEI/USDT 4-hour chart highlights a potential buy setup at a key demand zone:
Entry: $0.3160, anticipating a bounce from the current consolidation.
Stop-Loss: Placed at $0.2590, below the order block (OB) zone for risk management.
Take-Profit: Targeting the $0.3200-$0.3400 range for potential gains.
The highlighted OB zone reflects strong historical support, making this a high-reward trade with manageable risk. Confirmation from volume and candlestick patterns is recommended before entering the trade.

SEIUSDT 4DSEI ~ 4D Analysis
#SEI If you still have a Conviction on this Coin, buy gradually from here with a minimum target of 20%++

SEI LONG SEI is currently in a support zone at 0.25 and near the lower boundary of the descending channel. The price may continue to move within this descending channel until it reaches the 0.30–0.28$ range.A reaction is likely to occur from that zone where we have the nPOC and the 61.8 Fibonacci retracement level.

SEIUSDT 12H#SEI is moving within a falling wedge pattern on the 12H chart. Buy and hold. In case of a breakout, the targets are:
🎯 $0.4270
🎯 $0.4860
🎯 $0.5337
🎯 $0.5813
🎯 $0.6492
🎯 $0.7357
