Sei long to $0.2845Sei long to $0.2845. Just went long.
Currently attempting to flip bullish on 1hr tf and will also likely push to flip bullish on 4hr tf as well based on my analysis.
Roughly 3RR setup
Related pairs

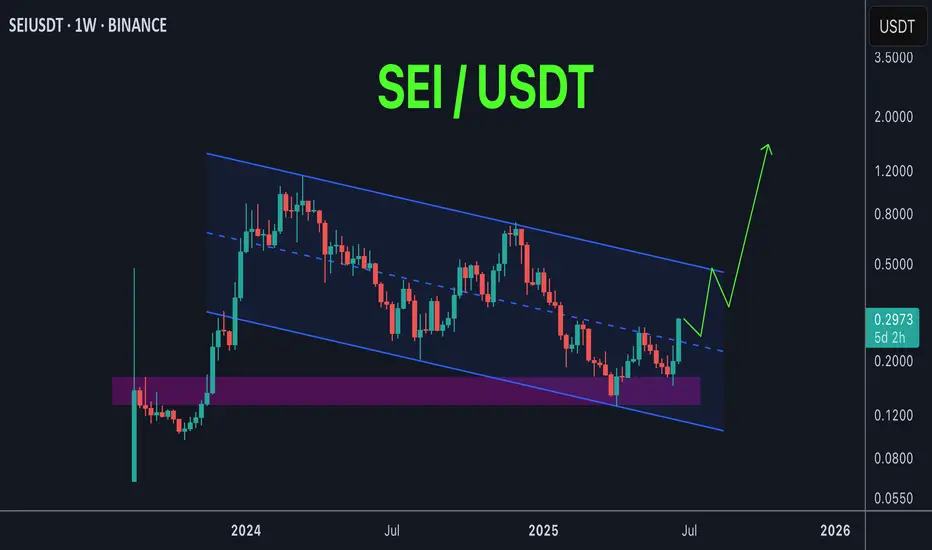
SEI possible playout SEI / USDT
Price is trading inside big descending channel
Next stop : price will hit the upper trendline of the channel and if managed to breakout this resistance it will skyrocket maybe to new ATH
Keep an eye on it …
SEI/USDT Poised for a Major Breakout – Will It Surge Toward $0.7📊 Full Technical Analysis:
The SEI/USDT daily chart reveals a compelling setup with strong breakout potential. Here's a detailed breakdown:
🔍 Pattern & Key Structure:
Descending Trendline Breakout: SEI has successfully broken out of a long-term descending trendline that has suppressed price actio

SEI Long – Breakout with Relative Strength & Trend ContinuationSEI is showing strong relative strength and has just broken out of recent structure. We’re watching for a higher low to form above the $0.22 zone, confirming trend continuation and unlocking upside liquidity.
📌 Trade Setup:
• Entry Zone: Around $0.22
• Take Profit Targets:
o 🥇 $0.29
o 🥈 $0.39
o 🥉

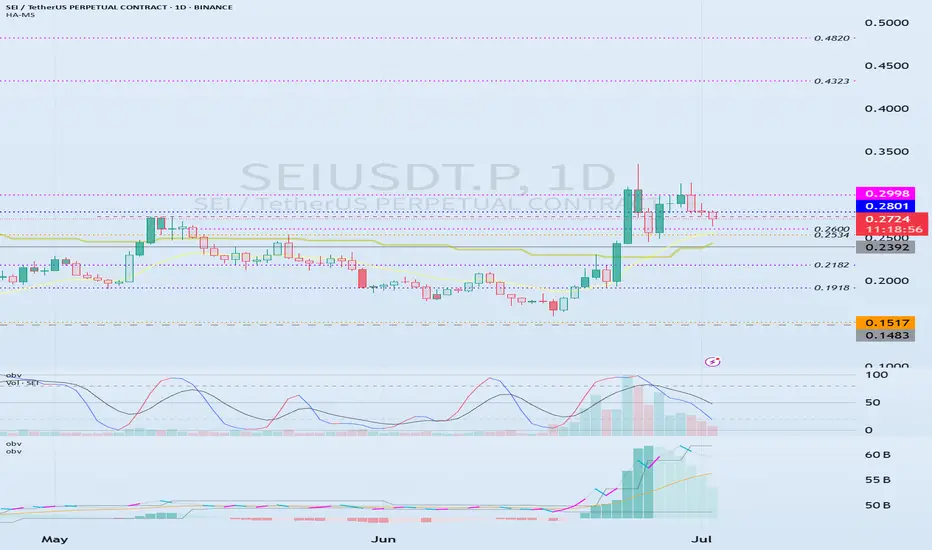
Important volume profile area: 0.2392
Hello, traders.
If you "follow", you can always get the latest information quickly.
Have a nice day today.
-------------------------------------
(SEIUSDT.P 1M chart)
I wonder what the 1M chart means on the futures chart, but if you know the current big picture trend, I think you can trade accor
SEI - One More Bullish Impulse Soon!Hello TradingView Family / Fellow Traders. This is Richard, also known as theSignalyst.
📈After surging by over 75% last week , SEI is currently in a correction phase.
However, it is approaching the intersection of the previous high marked in orange and blue trendline acting as a non-horizontal su

sei long again to $0.3Recently went long on sei, targeted the 4hr HH point. corrected a bit and went long again, this time targeting $0.3
Time sensitive. Still one can get Like 2RR + from it I think
stop could be tigher as well to around $0.2780

$SEI READY FOR NEXT MAJOR RALLY +80%Whats up traders!?! If i could ask you to LIKE if you found this content worth viewing and could provide value to others then smash that LIKE button and if you want to FOLLOW that would be awesome too! Thanks
A simple analysis on NYSE:SEI
The NYSE:SEI team is cooking and when i say cooking i m


Sei long to $0.3062Recently entered long on sei
Targetting the daily high area around $0.3062
Stop: 0.2788

See all ideas
Summarizing what the indicators are suggesting.
Oscillators
Neutral
SellBuy
Strong sellStrong buy
Strong sellSellNeutralBuyStrong buy
Oscillators
Neutral
SellBuy
Strong sellStrong buy
Strong sellSellNeutralBuyStrong buy
Summary
Neutral
SellBuy
Strong sellStrong buy
Strong sellSellNeutralBuyStrong buy
Summary
Neutral
SellBuy
Strong sellStrong buy
Strong sellSellNeutralBuyStrong buy
Summary
Neutral
SellBuy
Strong sellStrong buy
Strong sellSellNeutralBuyStrong buy
Moving Averages
Neutral
SellBuy
Strong sellStrong buy
Strong sellSellNeutralBuyStrong buy
Moving Averages
Neutral
SellBuy
Strong sellStrong buy
Strong sellSellNeutralBuyStrong buy
Displays a symbol's price movements over previous years to identify recurring trends.
Frequently Asked Questions
The current price of SEI / UST (SEI) is 0.26312000 USDT — it has fallen −0.20% in the past 24 hours. Try placing this info into the context by checking out what coins are also gaining and losing at the moment and seeing SEI price chart.
SEI / UST price has fallen by −11.29% over the last week, its month performance shows a 44.47% increase, and as for the last year, SEI / UST has decreased by −8.88%. See more dynamics on SEI price chart.
Keep track of coins' changes with our Crypto Coins Heatmap.
Keep track of coins' changes with our Crypto Coins Heatmap.
SEI / UST (SEI) reached its highest price on Jan 2, 2024 — it amounted to 1.43000000 USDT. Find more insights on the SEI price chart.
See the list of crypto gainers and choose what best fits your strategy.
See the list of crypto gainers and choose what best fits your strategy.
SEI / UST (SEI) reached the lowest price of 0.09499000 USDT on Oct 19, 2023. View more SEI / UST dynamics on the price chart.
See the list of crypto losers to find unexpected opportunities.
See the list of crypto losers to find unexpected opportunities.
The safest choice when buying SEI is to go to a well-known crypto exchange. Some of the popular names are Binance, Coinbase, Kraken. But you'll have to find a reliable broker and create an account first. You can trade SEI right from TradingView charts — just choose a broker and connect to your account.
Crypto markets are famous for their volatility, so one should study all the available stats before adding crypto assets to their portfolio. Very often it's technical analysis that comes in handy. We prepared technical ratings for SEI / UST (SEI): today its technical analysis shows the buy signal, and according to the 1 week rating SEI shows the neutral signal. And you'd better dig deeper and study 1 month rating too — it's sell. Find inspiration in SEI / UST trading ideas and keep track of what's moving crypto markets with our crypto news feed.
SEI / UST (SEI) is just as reliable as any other crypto asset — this corner of the world market is highly volatile. Today, for instance, SEI / UST is estimated as 1.35% volatile. The only thing it means is that you must prepare and examine all available information before making a decision. And if you're not sure about SEI / UST, you can find more inspiration in our curated watchlists.
You can discuss SEI / UST (SEI) with other users in our public chats, Minds or in the comments to Ideas.