SEIUST trade ideas

SEI 1D ANALYSISHi friends,
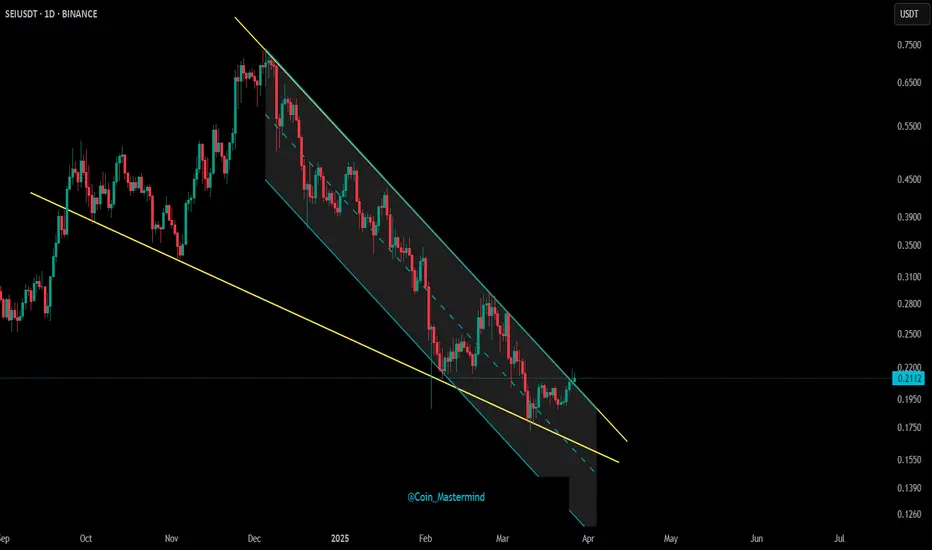
Today we pay attention to the SEI chart in the daily time frame; we have a local resistance level at the price of $0.2143, which is good for long entries after the daily candle closes above it.
It has a strong daily resistance trend line, which, after it breaks and pulls back, allows us to enter into long positions with volume confirmation.
The main daily resistance level is at the price of $0.3446

#SEI/USDT#SEI
The price is moving within a descending channel on the 1-hour frame, adhering well to it, and is heading for a strong breakout and retest.
We are seeing a bounce from the lower boundary of the descending channel, which is support at 0.1754.
We have a downtrend on the RSI indicator that is about to be broken and retested, supporting the upward trend.
We are looking for stability above the 100 moving average.
Entry price: 0.1823
First target: 0.1847
Second target: 0.1884
Third target: 0.1942

#SEI/USDT#SEI
The price is moving within a descending channel on the 1-hour frame, adhering well to it, and is heading for a strong breakout and retest.
We are experiencing a rebound from the lower boundary of the descending channel, which is support at 0.1600.
We are experiencing a downtrend on the RSI indicator, which is about to break and retest, supporting the upward trend.
We are looking for stability above the 100 Moving Average.
Entry price: 0.1614
First target: 0.1625
Second target: 0.1642
Third target: 0.1665

#SEI/USDT#SEI
The price is moving within a descending channel on the 1-hour frame and is expected to continue upward.
We have a trend to stabilize above the 100 moving average once again.
We have a downtrend on the RSI indicator that supports the upward move with a breakout.
We have a support area at the lower boundary of the channel at 0.1700.
Entry price: 0.1730
First target: 0.1764
Second target: 0.1808
Third target: 0.1850

SEI — Breakout + Strong Fundamentals = Perfect 1:9 SetupFinally broke the downtrend line — and it's not just about the technicals here. Fundamentals on SEI are looking really solid, and that adds even more confidence to the setup.
Planning to load on a small pullback and retest of the trendline — that’s where the real entry lies.
This one’s shaping up to be a textbook 1:9 RR play. Don’t sleep on it.
Enrty: 0.17-0.178
TP: 0.4
SL: 0.15
More thoughts in my profile @93balaclava
Personally I trade on a platform that offers low fees and strong execution. DM me if you're curious.

SEI - 2 Possibility 1 solutionSo smol range is easy move the big ranges is how it can move to be precise!!

$SEI BREAKOUT ALERT!🚨 BREAKOUT ALERT: NYSE:SEI
After months in a falling wedge, NYSE:SEI finally breaks out of chart targets with over 120% upside from here.
This could be the start of a significant trend reversal.
The chart doesn’t lie — are you in?
#SEI #Crypto #Altcoins
👇 RT if you caught it early!

SEIUSDT UPDATESEIUSDT is a cryptocurrency trading at $0.1700, with a target price of $0.4500. This represents a potential gain of over 200%. The technical pattern observed is a Bullish Falling Wedge, indicating a possible trend reversal. This pattern suggests that the downward trend may be coming to an end. A breakout from the wedge could lead to a significant upward movement in price. The Bullish Falling Wedge is a positive indicator, signaling a potential price surge. Investors are showing optimism about SEIUSDT's future performance. The current price may present a buying opportunity. Reaching the target price would result in substantial returns for investors. SEIUSDT is positioned for a potential breakout and significant gains.

SEIUSDT 1DSEI ~ 1D Analysis
#SEI Buy gradually after successfully penetrating this resistant line with a short -term target of at least 10%+.

Sei scalp short to $0.1530Just now took this sei scalp short.
Not necessarily according to main strategy. It just seems likely to retest $0.1537 to $0.1530 to me before actually pushing higher.

SEI: Your Altcoin ChoiceThe last session produced the highest volume since November 2024 and activated the baseline of a rounded bottom pattern that launched the first SEIUSDT bullish wave.
SEI's first bullish wave produced more than 1,101% growth. The peak happened in March 2024. After this peak, bearish all the way. The next major low happened on the 7-April 2025 trading session, 3D. More than a year of bearish action. I say this is enough.
A long-term higher low is present vs October 2023. The chart is clear and easy. Market conditions are about to change. The high volume on the more than a year strong higher low indicates that buyers were present. Support is activated but still early. Confirmation comes when multiple sessions close green without the last low, 0.1303, getting challenged again.
I don't think we should wait for confirmation. The wise move would be to do like the whales and start an accumulation phase. Instead of waiting for a certain market condition to be met, once support is hit we start to buy as much as we can. Prices will always fluctuate and fake signals are the norm. The market can move down and pierce support just to produce a fake bearish signal and then grow. It is very hard if not impossible to predict the short, short-term. When focusing on the bigger picture, we know the market is set to grow next. Knowing this, we buy, accumulate, as much as we can in anticipation of this bullish wave.
It is early but a long-term correction is over. What follows, is growth.
Thank you for reading.
Namaste.

The Bullish Case of SEI#SEI has been in a downtrend since topping in March 2024, forming what appears to be a wave (2) zigzag correction.
It recently bounced off a key Fib cluster, potentially marking a major bottom.
Passing $0.735 confirms targeting the ATH.
Breaking $0.095 invalidates the idea.

SEIUSDT 3DSEI ~ 3D Analysis
#SEI Buy back while visiting this support with a short -term target of at least 20%+.

SEI/USDT:BUY LIMITHello dear friends
Given the price drop we had in the specified support range, the price has been able to create higher ceilings and floors.
Now, given the good support of buyers for the price, we can buy in steps with capital and risk management and move towards the specified goals.
*Trade safely with us*

SEI chart suggest that the supply is slowing down. SEI is in a falling wedge with 3 drives of class A bullish divergence. Both momentum and trend oscillators are in an uptrend coming from oversold conditions. The best part is there is some horizontal support at this level.
Full TA: Link in the BIO

#SEI/USDT#SEI
The price is moving within a descending channel on the 1-hour frame and is expected to continue lower.
We have a trend to stabilize below the 100 moving average once again.
We have a downtrend on the RSI indicator, supporting the upward move with a break above it.
We have a resistance area at the upper limit of the channel at 0.1920.
Entry price: 0.1915
First target: 0.1851
Second target: 0.1813
Third target: 0.1770

SEI New Update (1D)This analysis is an update of the analysis you see in the "Related publications" section
Considering the strength of the wave and the status of Bitcoin and other key indices, we have slightly lowered the support zone, as this coin may form a deeper correction for wave C.
We have also updated the targets.
Let’s see what happens.
For risk management, please don't forget stop loss and capital management
When we reach the first target, save some profit and then change the stop to entry
Comment if you have any questions
Thank You

SEI/USDT LONG TERM SETUPNYSE:SEI is holding the $0.18 support, showing signs of accumulation.
Backed by big players (e.g., Trump’s World Liberty).
Flip $0.218
Potential move to $2.....
Not financial advice.
DYOR.

SEI Poised for a Breakout After Bold 23andMe Acquisition Bid !Sei (SEI), the innovative layer-1 blockchain designed for high-speed trading and decentralized finance (DeFi), is flashing strong bullish signals both fundamentally and technically. The recent news that the Sei Foundation is exploring the acquisition of 23andMe, the leading personal genomics company, has sparked excitement in the market. If successful, this strategic move could position Sei at the forefront of the multi-billion-dollar genomic data industry — combining blockchain’s security and transparency with the rapidly growing demand for data privacy.
Why This Is Huge
23andMe recently filed for Chapter 11 bankruptcy protection, opening the door for a potential buyout. The Sei Foundation’s plan to migrate genetic data onto the blockchain would give individuals direct control over their data, allowing them to decide how it’s used and even monetize it. This taps into a massive and underserved market where data security and privacy are becoming critical issues.
Bullish Chart Setup
From a technical perspective, Sei’s chart is showing signs of a major breakout:
✅ Double Bottom: SEI has recently formed a clear double bottom pattern, signaling a strong reversal from recent lows. This is a classic bullish pattern that suggests the selling pressure has been exhausted and buyers are stepping in.
✅ Falling Wedge: SEI is also breaking out of a falling wedge, a high-probability bullish formation. Falling wedges typically lead to strong upside moves as downward momentum fades and buying pressure builds up.
✅ Volume Increasing: Recent spikes in volume confirm that smart money could be accumulating in anticipation of a breakout.
Perfect Storm for a Rally
With a bullish technical setup aligning with a game-changing fundamental catalyst, Sei could be on the verge of a major breakout. A successful acquisition of 23andMe would not only give Sei real-world utility in the health data sector but also drive increased adoption and network activity. If SEI clears key resistance levels, this combination of technical strength and strategic growth could send the token to new highs.
Sei isn’t just another DeFi project — it's positioning itself to be a leader at the intersection of blockchain, health data, and privacy.
This could be the beginning of a powerful new trend for SEI. 🚀

$SEI at Breakout Point – Will Bulls Take Control?
SEI is showing signs of a potential trend shift, with key patterns forming on multiple timeframes. A confirmed breakout could trigger strong upside momentum.
SEI 1D Update:
- Breaking out of a falling wedge, a typically bullish reversal pattern.
- A successful breakout could lead to an upward move.
SEI 4H Update:
- Moving inside an ascending channel, holding support within the structure.
- As long as the channel holds, upside potential remains intact.
Watching for confirmation of the breakout and a momentum shift to the upside! 🚀
#SEI/USDT#SEI
The price is moving within a descending channel on the 1-hour frame, adhering well to it, and is heading for a strong breakout and retest.
We are seeing a bounce from the lower boundary of the descending channel, which is support at 0.1880.
We have a downtrend on the RSI indicator that is about to be broken and retested, supporting the upward trend.
We are looking for stability above the 100 Moving Average.
Entry price: 0.1944
First target: 0.1979
Second target: 0.2017
Third target: 0.2059

Falling Wedge Forming on $SEI !!NYSE:SEI is forming a falling wedge—a bullish pattern!
Price is squeezing near support, and a breakout could send it flying.
The chart hints at a possible strong move up soon.
Keep an eye on SEI.
This could be the start of a trend shift.
DYOR, NFA
