SEi's Points of Interest.SEi 1d
Price is currently sitting on the ma200 acting as support, it is also in the flip zone where price had a multiple reactions. 5 wave count marking the start from the lowest low, it is now down by 45% from the last swing high. MA100 + bullish OB on the breakout of wave3 fails to hold as support and in turn become a breaker/resistance when price made a turn upwards. Connected swing lows to form the trendline support. Possible scenarios would be:
1. Inducement taken out around 0.37, fill small gaps & mitigate demand zone of wave 4.
2. Raid wave 4 lows, fill gaps and mitigate demand zone of wave 2.
3. Bounce on the ma200+trendline support
SEIUST trade ideas


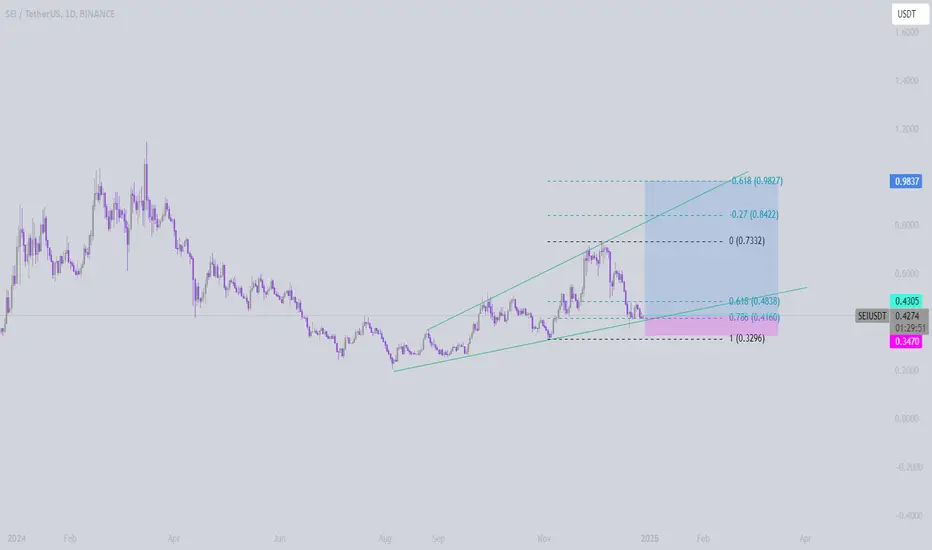
Bullish Channel Setup with Two Key Scenarios | $SEITECHNICAL ANALYSIS: 🎯
Price Structure:
- SEI is currently trading within a well-defined ascending channel (marked by orange lines)
- Current price: $0.4156 (-2.49%)
- Strong demand zone established between $0.28-0.35 acting as key support
Two Potential Scenarios for Q1 2025:
Scenario A (Purple Path):
- Immediate bounce from current levels
- Series of higher highs and higher lows
- Price target: $0.85-0.90 by March 2025
- Key resistance levels to watch: $0.55, $0.65, $0.75
Scenario B (Light Blue Path):
- Initial retest of demand zone ($0.30-0.35)
- Sharp V-shaped recovery
- Same ultimate target: $0.85-0.90
- Higher risk-reward ratio if demand zone holds
Key Levels to Watch:
▪️ Major Support: $0.35 (Top of demand zone)
▪️ Current Channel Support: $0.41
▪️ Channel Resistance: $0.52
Risk Management:
- Stop Loss: Below demand zone ($0.28)
- Position scaling opportunities at demand zone retest
- Channel breaks should be monitored for validation/invalidation
Timeframe: Daily
Bias: Bullish with caution
Pattern: Ascending Channel
Note: This is technical analysis only. Always DYOR and manage your risk accordingly. Not financial advice.
#SEI #Crypto #TechnicalAnalysis #Binance

SEI ON THE VERGE OF…If 0.40$ is held and we see bullish candles we wait for 1$
The price can also reach 0.34$, then the head and shoulders pattern will be confirmed. then we will see an attempt for breaking the shoulder at 0.50$. It fails and we wait for 0.20$, breaks it and again we HODL until 1$.

SEI BUY...hello friends
Considering the support range we are in, we expect a short-term growth from this currency.
Be sure to observe capital management.
Be successful and profitable.

Sei/usdt longAlmost every altcoin has pull backed at least 45%.
Sei looks good.
LOng and strong.
Soon dominance will start its downtrend.
Golden Cross 4H 1D🚨🚨🚨 NOT FINANCIAL ADVICE 🚨⚠️
Just noticed a golden cross appear on both the 4H and 1D charts for NYSE:SEI as much as it's been dragging rear the last bit we need to read between the lines here. The RSI, The moving averages, the sideways price movement.
Previously discussed idea of a big bounce back from correction is becoming more and more viable by the day. Now with GC appearing on the 4hr and 1D I'm so pumped
Whose coming ?
SEI enter between $0.43-$0.44250
No more then 10x if leveraged (preference goes to spot if your not a seasoned futures trader)
TP: $0.55
TP2: $0.60
TP 3: 0.63
Longer term
TP: $0.65
TP2: $0.75
TP3: $0.82
TP for new investors or scalping is $0.55
You could also do a trailling TP at the three levels
Again not financial advice of any kind do your own research.

SEI M PATTERN and BULLISH DIV SEI M Pattern long end target, bullish div to support
0.80 cent is target 0.67 for safety.
Keeping it simple BTC could mess this up though.

#SEI/USDT#SEI
The price is moving in a descending channel on the 1-hour frame and is expected to continue upwards
We have a trend to stabilize above the moving average 100 again
We have a descending trend on the RSI indicator that supports the rise by breaking it upwards
We have a support area at the lower limit of the channel at a price of 0.4500
Entry price 0.4555
First target 0.4634
Second target 0.4753
Third target 0.4890


wave cIt is possible to continue moving in wave c until the yellow box.
corresponding to the levels of 0.618 and 0.707.

Last call SEI LONG I don't provide any financial advice as I'm not a licenced advisor, simply a mama gone rouge 🤣🥳 but if it were me I'd love to know it's "Last call" for Christmas cash 🎯🛍️👏🏼🚀
SEI is recovering from its lowest low in a while.
Chart pattern shows an incredible HNS targeted over $1 on the daily charts.
Targets anywhere from $0.60 to $0.70, to $0.85, and for Christmas Eve im feeling a BFP over $1.
This one is pretty much sky's the limit imo especially looking at the bigger picture 4hrs-1Month. Looks real good.
RSI is in the toilet.
So ready for some Christmas magic 🪄
Agree or disagree all good.
These are my ideas 💡

SPOT SEI LONG 23.12.2024Fixation after buyout of correction.
🎯Purpose:
0.5417
‼️Risk per trade: 0.5% of the allocated funds for spot trading.
Thank you for subscribing and responding🚀.

SEI/USDT Chart Analysis NYSE:SEI
#SEI Token is forming an ascending channel pattern on the daily chart💁♂️
Price is testing a strong ascending support line with increasing buying volume🔼
Currently holding above the ma 200 showing bullish pressure📈
A successful bounce could drive price towards targets at
$0.465
$0.540
$0.645
$0.81

SEI 1D Idea Update We are still feeling pretty bullish.
Trade active.
Let's pump it 👏🏼👏🏼👏🏼👏🏼
* NOT financial advice* FOLLOW for more 🚀

ATOM USDTNASDAQ:ATOM
#ATOM Cosmos is facing the resistance at descending triangle boundary on the weekly chart🔍
Bounce off the support zone at $6.10 could push price towards targets at $10.00, $15.50, $21.50 and $32.50👨💻

SEI USDTNYSE:SEI
#SEI Token is forming an ascending channel pattern on the daily chart💁♂️
Price is testing a strong ascending support line with increasing buying volume🔼
Currently holding above the ma 200 showing bullish pressure📈
A successful bounce could drive price towards targets at $0.465, $0.540, $0.645, and $0.725🎯

SEI Update I believe it's time for us to prepare for a correction in the market, as this correction is necessary for a healthy upward trend. Let’s approach it with respect 🤝 :)
"By the way, before this correction, we will experience an upward movement in the market."

SEIUSDT 3DSEI ~ 3D
#SEI If you still have Conviction on the coin,. Buy gradually within this support block. with a short term target of at least 20%++

The last call for entry $SEI coinI expect a big rebound after retesting 0.50 on daily 3 times last 2 weeks in my opinion this time will break 0.70 to reach new ath which is above 1$

SEI/USDT - Swing PositionDate: 09/12/24
Name: SEI/USDT
Market cap
$2.16B
7.66%
Volume (24h)
$298.1M
12.52%
FDV
$5.12B
Vol/Mkt Cap (24h)
13.82%
Total supply
10B SEI
Max. supply
--
Circulating supply
4.2B SEI
Daily Time Frame – Swing Position – Long!
Reasons to be Bullish Case:
1) Structure: Overall trend is bullish, Trending.
2) Current phase: Break of structure, and continuing the uptrend
(4) Internal: Structure Shift towards upside, Pull Back done, uptrend continuation, internal Shift, ready to sky rocket.
(5) Important Key notes: .
- Relatively new project for this bull cycle, Great fundamentals, overall uptrend since launch. Quite bullish. Needs a catalyst to sky rocket.
- Currently holding Previous resistance as its support and key level on Daily Time frame
Worst case Senerios:
4) Bitcoin is currently at All time high, liquidation flush remaining ($75k – $80k)
5) Due to liquidity generated and Demand zone sitting below.
6) if $0.44 is not hold, then we can see further buying opportunities on marked point of interests.
7) Invalidation – $0.33
Trade Plans:
BUY CMP: $0.64
DCA: NYSE:CMP – $0.33
Invalidation: 0.33
Trend Based Fibionacci Targets:
Target 1: $1.29
Target 2: $ 1.93
Target 3: $ 2.33
Target 4: $ 2.98
**This is not a financial advice, these are my personal trade journals, Do your own research before taking any action. **

#SEI/USDT Ready to go higher#SEI
The price is moving in a descending channel on the 1-hour frame and sticking to it well
We have a bounce from the lower limit of the descending channel, this support is at 0.5040
We have a downtrend on the RSI indicator that is about to be broken, which supports the rise
We have a trend to stabilize above the moving average 100
Entry price 0.5100
First target 0.5277
Second target 0.5500
Third target 0.5825

SEI/USDT GOT WHAT YOU GUYS HAVE BEEN SEARCHING IN THIS RUN!!!!!The SEI/USDT chart is a treasure map for adventurous investors. Let’s dive into the enticing details:
Upward Trend Momentum: The chart radiates 'Long' signals, especially as the year wanes. This suggests buoyant bullish waves are crashing, hinting at positive market vibes.
MACD Indicators: The MACD line twirls with vibrant crossovers—an invitation to buy. Nestled in a healthy zone, these oscillations beam with rising momentum, teasing the prospect of growth.
Potential Breakout: Recent price action is snugly settling around $0.56. Yet, earlier bullish strides show glittering potential. Should the ascent persist, we might just break free towards $1.00 shortly, with long-term dreams flirting with $5.00 if momentum perseveres.
Volume Analysis: Volume struts in strong and steady, adorned with a playful mix of green and red bars. This reinforces the ongoing trend, elevating our confidence.
Risk vs. Reward: The chart displays a tantalizing risk-to-reward ratio. Investors could seize the moment at current price points, eyeing notable milestones like $1.00 and beyond. With eyes set on $5.00 ahead, keep watch for any looming corrections.
Key takeaway: This asset brims with potential, buoyed by bullish momentum and a mouthwatering setup for astute investors ready to play their cards wisely. Stay vigilant by monitoring key support levels to shield against any downside waves.
