SEKEUR trade ideas

OPEN EURSEK daily tradeThe buy zone is between the the green and red lines. It's recommended to limit buy close to the green line, in order to guarantee the position. The red line is about 250 pips below the green line, and acts as the stop-loss level. There is no target price yet. This trade will be monitored once every evening. If there is no update, it means the trade is still active. Once the trade is closed successfully, a risk-to-reward ratio will be determined. This strategy only requires reviewing the price action trend once every day.

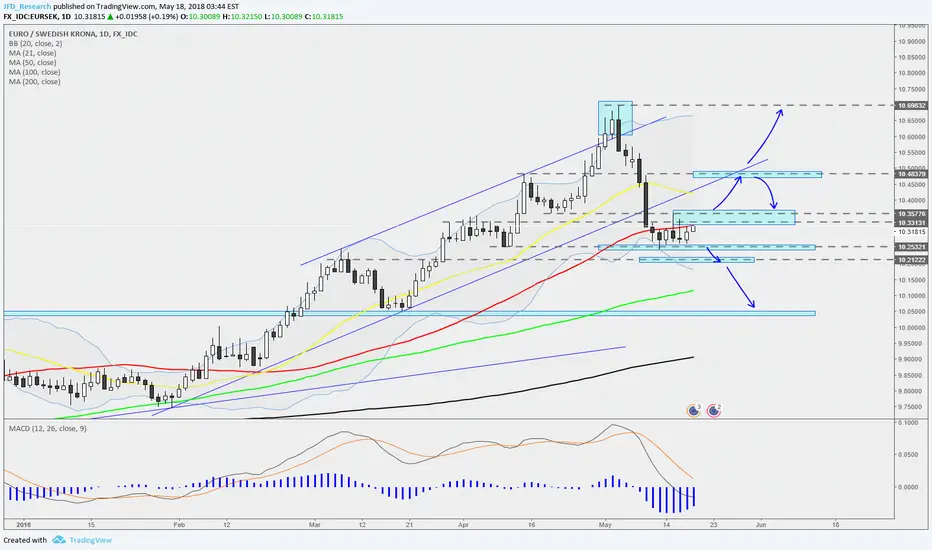
EURSEK - Daily - Watch the boxEURSEK continues to move sideways within a determined range.
We need to wait for a break through one of the sides of that range in order to jump into the action.
Study the chart for a possible trade idea. Keep in mind, that there is always a chance for a false breakout as well.
Don't forget your stops!


EURSEK - 60min Timeframe - Update on Short OpportunitiesFollowing our monthly timeframe overview on EURSEK (), we believe that the pair could have commenced a really big downward move which will continue for many months ahead. After the downwards impulse the pair has developed over the first two weeks of May, EURSEK has spent most of this week consolidating, on the 60min and 4hr timeframes. A great opportunity for opening new short positions, on the break of the minor trend it is forming.
Monitor price action with attention, as the pair could be shaping up into a more complex correction.
If you feel that our analyses and views may be a useful complement to your trading strategies and in order to be notified in real time with our updates on the lower timeframes, please remember to click on the Follow button.
Remember that you can double check the bigger structures that are at play are on the weekly and daily time frames also by scrolling around the charts in the lower 4hr and 60min timeframes (right and left, up and down).
Trade with care and only with a backtested strategy that has proven to work in relation to your invested capital, risk appetite and potential small losses you might incur in before profiting from a good trade.
Thank you for viewing.

EURSEK - Monthly Timeframe Overview - Beginning of a downtrend?As the pair reached the 0.618 Fib of what could appear to be a wave 5 extension, it suddenly dropped. So far, being there similar movements all across the board, it definitely seems to be a euro driven movement. Having said that, the downward move occurred over the last weeks marks either the end of the uptrend (if we see the price movement of the last five years as an uptrend), or the end of the upwards correction and the resuming of the big monthly downtrend (if we see said movement as a correction). Reason for which, whichever is the scenario playing out we will be looking for sell setups only, on this pair. In the medium term, we expect the price to head towards the trend line target and then towards the 9.12 area, if the trend breaks. If the trend holds, instead, and the pair goes for one more up move then we would definitely be in a monthly correction.
Updates on smaller timeframes will follow.
If you feel that our analyses and views may be a useful complement to your trading strategies and in order to be notified in real time with our updates on the lower timeframes, please remember to click on the Follow button.
Remember that you can double check the bigger structures that are at play are on the weekly and daily time frames also by scrolling around the charts in the lower 4hr and 60min timeframes (right and left, up and down).
Trade with care and only with a backtested strategy that has proven to work in relation to your invested capital, risk appetite and potential small losses you might incur in before profiting from a good trade.
Thank you for viewing.

EURSEK - Daily - ConsolidatingTrade Alert
So we are seeing a bit of consolidation right now. Waiting for a break through one of the levels shown.
Don't forget your stops.

EURSEK Buy IdeaEURSEK Buy Idea @Daily Demand Zone (10.29885 - 10.25220)
Buy Limit: 10.30094
Stop Loss: 10.24477
Take Profit: 10.37241

Break of the trend line on EURSEKEURSEK has just broken the trendline on Daily, with a bearish candle has forming below. Stoch is pointing down and is below 50% and the MA's have just crossed. This ticks all the boxes for me to open a trade.

EUR/SEK 1H Chart: Euro breaches four-month channelEUR/SEK was trading in a four-month ascending channel prior to breaching this pattern to the downside on Wednesday. This movement shows that the Euro is ready to continue trading lower in line with the senior channel. The upper boundary of this long-term channel was tested on March 3 when the rate reversed from its eight-year high of 10.68.
As it was stated, the pair’s movement is expected to be southwards during the following weeks, while the a shorter-term forecast favours a bullish correction, as the considerable 1.45% fall yesterday sent technical indicators in the oversold territory.
The nearest resistance is set by the 55-hour SMA at 10.47. A breakout of this level should result in a test of the 23.60% Fibonacci retracement, the 100-hour SMA and the monthly PP at 10.50 or even further up to the 200-hour SMA and the weekly PP near 10.55.


The EURSEK Retesting Pivot SupportWe last posted on the EURSEK on April 25th when price was showing signs of bouncing off an April pivot support.
Price did indeed gather momentum and break through the resistance high of April which is now being retested as support. This retest of resistance-turned-support is very much a natural feature of this trend and one that has brought linearity to the structure of the trend.
We have marked in all the levels of support that have been retested following a breakout and so what we are seeing in price now is very much a feature of this trend structure. Understanding this has huge benefits.
It allows us to plan for when we will enter and compound into the positions that we have open. It allows us to eliminate the stress and not get caught up in the ebbs and flow of profit but instead focus on the process. It also allows us to understand how to place and manage our stop-losses so that we do not get stopped out prematurely and, instead, hold our positions throughout the duration of the trend.
What we know want to see on the EURSEK is price hold at this current support level, bounce to the upside and break and close above the high of May. This will then suggest a trend continuation to the next resistance level of 11.0000 and when we will consider adding further compounds.
This is a very attractive looking trend so far and certainly one of the better looking trends in FX in quite a while. We do not want to see this come to an end anytime soon.
Any comments or questions, do not hesitate to leave them below. Hit agree if you share our sentiments!
Sublime Trading

EURSEK - Daily - If the Fib extension is correct...After today's morning, when the Riksbank left the rate unchanged, we saw some selling in the SEK, which pushed the EURSEK higher, towards the recent high at around 10.49 level.
At the moment we are seeing a struggle in breaking that level, but the pair still has got some time.
If the Fib extension is correct, then there is a chance for EURSEK to to break the 10.49 and move towards the 1.618% extension, which is around 10.59 area. This idea could also be supported by the upwards moving channel that the pair is currently trading in.
That said, if the 10.49 level holds, then we could see a double top forming on this daily chart.
Be careful and keep an eye on the price action!

Buying the dips with EURSEK Back in 2014 when I first joined the trading floor, EURUSD and USDSEK were two of my most profitable FX trades. This year, not EUR nor SEK, it's EURSEK gaining me profit.
Pilot position (pink arrow) triggered following the bounce off the support cluster including the figure 10, the 2016 and 2017 highs.
First compound (green arrow) taken based on the tram track formation bouncing off the March 2018 high.
Second compound (red arrow) went in a few days ago following the latest dip.
Out of my three running positions, the first 2 are running with profits and the last one is close to risk free.


The EURSEK Bouncing Off SupportWe last posted on the EURSEK on April 20th when price had broken above followed by a pull back to the drawn-in pivot support level.
This pivot level so far has held strong and we are seeing strength to the upside. We want to see the momentum to the upside continue and take price through and close above the pivot high of April and ideally in the form of a bullish flag.
If the bullish flag does not materialise then that will mean further patience until the breakout is confirmed. Either way, we require a breakout for a continuation of the bull trend to be likely and until that happens we will be holding tight and applying patience.
If the breakout does happen then we would like to see price move towards the next key level of 11.0000 and offer opportunities to compound on its ascent. We have a long position
As the trend suggests, if the breakout does happen, expect a pullback to retest this current April high before a bounce up.
Embrace and expect pullbacks as they are a natural feature to price action. These are areas where many panic and lose money or get out of winning positions way too early or areas where people often are sucked in to go against the trend but fail.
Those who have a solid understanding of the natural features of price will simply stand aside and apply patience and wait for price to dictate a breakout to the upside in the case of the EURSEK.
Any comments or questions, do not hesitate to leave them below. Hit agree if you share our sentiments!
Sublime Trading


EURSEK Pullback!EURSEK was last mentioned in this post after price broke through a resistance level.
Since then price has started to pull back which is a part of trading. If we look at the history of this forex pair, we can see that price tends to use previous areas of resistance as support levels so we will have to see if price will do the same with this recent support level.
If price bounces off support then we should see price move up to create new highs. If the support level is broken then we may see a change in direction or it may just be a deep pullback to another support level before the continuation of the trend. Price may even move down towards the 50 simple moving average.
As the overall trend is bullish and the higher timeframes are showing a bullish bias then we just have to sit back and wait for price to make the next move.
Remember that in order to make profit as a trader we need to cut our losses short and maximize our winning trades. So in this case, if support levels are broken, know when to close the trade and avoid bringing emotions into it.
The next few trading days may determine where price will be heading so we shall have to wait and see.
Any comments or questions, do not hesitate to leave them below. Hit agree if you share our sentiments!
Sublime Trading

EURUSEK: In retracing modeThe RSI has been indicating a negative divergence and the oscillator is remaining bearish
We expect the cross will face selling pressure. To limit the risk selling can use sl at 10.5350 targets 10.26/1.25 initially

The EURSEK Triggering Long TradesThe EURSEK is new to our blogs but one we do have long positions in play on.
Yesterday, we featured the GBPSEK and the emergence of a possible bull trend. The EURSEK is looking just as appealing with a slightly more advanced setup with price action and hence why our long trades were placed.
Like several currencies that we have highlighted, this currency was also in a period of consolidation that dated back to last year. Price eventually broke of consolidation in February of this year which also took price above the key round number of 10.0000.
With this level now acting as support, we wanted to see a retest of this level which did happen in March. Since then, price has bounced off this level and has offered multiple entry points in the form of pullbacks and breakouts as this bull trend has continued.
The EURUSEK has been trending very well since bouncing off the support zone that involved the 200SMA at the end of January of this year. The trend structure that has emerged is linear with clean pullbacks that have retested the resistance-turned-support levels.
It is very much early days on this currency. We would like to see this trend structure continue all the way through to the all time high in 2009 which was just short of 12.0000, offering strategic opportunities to compound on its ascent.
If 12.0000 resistance is broken then 15.0000 would be the next key level.
This is certainly one of the more appealing trends in the FX market right now.
Any comments or questions, do not hesitate to leave them below. Hit agree if you share our sentiments!
Sublime Trading

SELL EURSEK: pivot brekout after bullish flag breakout.I bought it after the pivot breakout in a buy limit so I could avoid a bit of the spread.
Our target is at the 100% fibonacci projection being careful with the possible resistance line. The stop is at the botton of the same pivot.

Harmonic patternHello,
Even if I am not a Harmonic trader and follower, but this one looks like a perfect Crab pattern and 1.618% extension of leg XA is almost hit.
Bearish confirmation around this level and I will short targeting back below 10. Even in case of an extension of this CD leg, its still interesting for short.
