EURSEK - potential upside move??- price now at support
- retail sentiment is now at 46% net short, almost double from 26% net short 5 days ago
what do you think?
SEKEUR trade ideas

Pullback In A Trend | EMA 10 | EMA 20 | Pin Bar | EURSEKEnter at Pin Bar Close. Exit At Previous Swing High For Take Profit. Place Stop Loss At Pin Bar Low. H1 Chart.


EURSEK down to $10.09EURSEK is currently in a structure area. When it breaks to the downside there’s a good chance it will go down to $10.09

Break and RetestHello Traders,
Here is the analysis for this pair, let me know in the comment section below if you have any questions, the entry will be taken only if all your rules of the strategies will be satisfied.
Good luck!

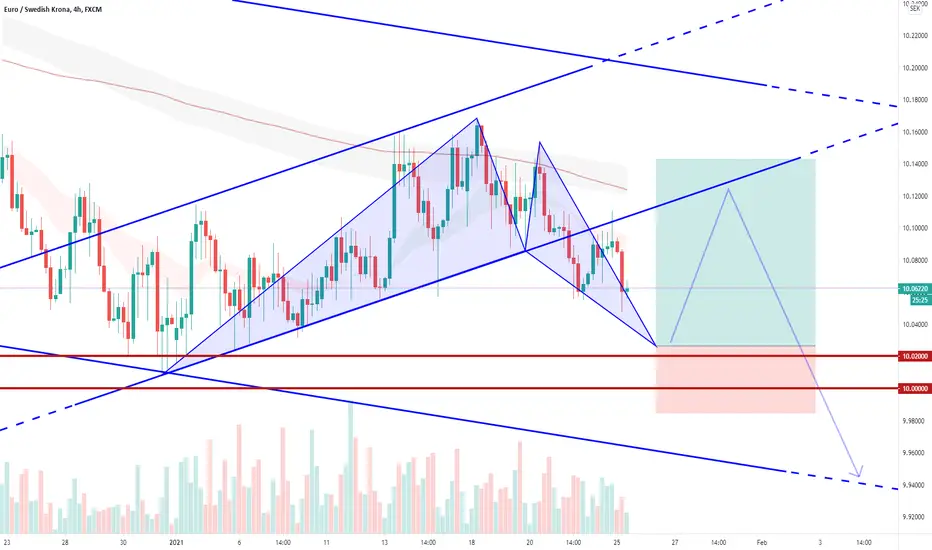
EURSEK on a bear flag 🦐EURSEK after the recent lows started a retracement move to the upside inside a minor channel.
The price now reached the weekly resistance and according to Plancton's strategy if the price will break below we can set a nice short order.
–––––
Follow the Shrimp 🦐
Keep in mind.
🟣 Purple structure -> Monthly structure.
🔴 Red structure -> Weekly structure.
🔵 Blue structure -> Daily structure.
🟡 Yellow structure -> 4h structure.
⚫️ Black structure -> <4h structure.
Here is the Plancton0618 technical analysis , please comment below if you have any question.
The ENTRY in the market will be taken only if the condition of the Plancton0618 strategy will trigger.


EURSEK BUYBuy immediately.
Above 200 and 50 EMA, Supertrend gives a green light to go long. Good Luck.

EURSEK 1D RANGE TRADINGRanges are repeatable trading chart patterns.
Ranges are consolidation chart patterns that can breakout either direction.
Each chart pattern will have defining trendlines of the support/resistance levels creating the pattern.
What ever time frame you are trading this chart pattern, wait for a candle close outside of the trendline in the direction of the breakout candle. (Our time frame preference is the Daily chart).
Add volume indicator - Volume is the amount of $ that went into a particular candle or in Forex the # of trades that took place.
Add ATR indicator - Volatility is the amount of price movement that occurred. Use the ATR to measure the price movement.
When you see descending Volume bars and descending ATR line (which indicates volatility) this shows
a dis-interest in traders to invest in this pair creating consolidation which creates the chart pattern.
Trade Management after there is a breakout candle close.
1 - Position size (compare volume bar to volume ma line).
a - Breakout candle must be 100% of volume average for a full position size.
b - If 75% of volume average then ½ position size. (To find 75% of Volume
look at the charts volume settings – divide smaller # into larger # = 75%+)
If not 75% then stand aside from the trade.
2 – If candle breaks out of a trendline, 15m before the close of the day prepare your buy/sell order.
Enter two trades. 1st trade will have a SL & TP. It will close automatically when the 1st TP is hit. 2nd
trade only has a SL and will be allowed to run. When 1st TP is hit move the SL to breakeven. Look
at ATR and prepare SL at 1.5 of ATR. Prepare 1st trade TP at 1 of ATR.
3 - SL for both trades will be 1.5 x ATR.
4 - 1st trade TP will be 1 x ATR.
5 - No TP on 2nd trade – letting profit run and adjusting SL to follow price.
6 - When 1st TP hit – move 2nd trade SL to breakeven.
7 - Adjust the 2nd trade SL to follow price.
*8 – After Breakout candle – if price closes back into chart pattern close trade don't wait for SL to be hit.
*9 - When breakout candle is more than 1 ATR from breakout candle open.
a - Enter 1st trade at candle close with ½ position size.
b - Enter 2nd trade with a pending limit order that is 1 ATR of breakout candle open.
c – Price should pullback to that pending limit order for 2nd trade.
d – If Price returns back into chart pattern close trade before SL is hit.

LONGAs we can see, this is the perfect and clearest example of a inverted shoulder-head-shoulder pattern. Plus, we have an ascending triangle at the 4H timeframe.

EURSEK 1D RANGE TRADINGRanges are repeatable trading chart patterns.
Ranges are consolidation chart patterns that can breakout either direction.
Each chart pattern will have defining trendlines of the support/resistance levels creating the pattern.
What ever time frame you are trading this chart pattern, wait for a candle close outside of the trendline in the direction of the breakout candle. (Our time frame preference is the Daily chart).
Add volume indicator - Volume is the amount of $ that went into a particular candle or in Forex the # of trades that took place.
Add ATR indicator - Volatility is the amount of price movement that occurred. Use the ATR to measure the price movement.
When you see descending Volume bars and descending ATR line (which indicates volatility) this shows
a dis-interest in traders to invest in this pair creating consolidation which creates the chart pattern.
Trade Management after there is a breakout candle close.
1 - Position size (compare volume bar to volume ma line).
a - Breakout candle must be 100% of volume average for a full position size.
b - If 75% of volume average then ½ position size. (To find 75% of Volume
look at the charts volume settings – divide smaller # into larger # = 75%+)
If not 75% then stand aside from the trade.
2 – If candle breaks out of a trendline, 15m before the close of the day prepare your buy/sell order.
Enter two trades. 1st trade will have a SL & TP. It will close automatically when the 1st TP is hit. 2nd
trade only has a SL and will be allowed to run. When 1st TP is hit move the SL to breakeven. Look
at ATR and prepare SL at 1.5 of ATR. Prepare 1st trade TP at 1 of ATR.
3 - SL for both trades will be 1.5 x ATR.
4 - 1st trade TP will be 1 x ATR.
5 - No TP on 2nd trade – letting profit run and adjusting SL to follow price.
6 - When 1st TP hit – move 2nd trade SL to breakeven.
7 - Adjust the 2nd trade SL to follow price.
*8 – After Breakout candle – if price closes back into chart pattern close trade don't wait for SL to be hit.
*9 - When breakout candle is more than 1 ATR from breakout candle open.
a - Enter 1st trade at candle close with ½ position size.
b - Enter 2nd trade with a pending limit order that is 1 ATR of breakout candle open.
c – Price should pullback to that pending limit order for 2nd trade.
d – If Price returns back into chart pattern close trade before SL is hit.

EURSEK shortDescenting triangle formation on both the 1h and 4h charts. The bottom of the triangle matches the 0 fib level.Waiting for the breakout before entering a trade.

EURSEK Currection finishLock at the chart and Enjoy Harmonic Elliott wave analyse power!
I Love Copsey

EUR/SEK: UPDATE PRICE ACTION ON DAILY TMF + SHARK FORMATION 🔔Welcome back Traders, Investors and Community!
Analysis of #EURSEK
If you have found this useful then help us support my page by hitting the LIKE button.
If you are not subscribed yet then please feel free to follow my page for daily updates and ideas. Thank you
It means a lot to us!
***
Strategy: Bearish Shark pattern on Bearish Flag - We will be waiting for all the confirmations to enter in this trade.
A clear chart is Always the best business card for a trader.
***
Your support and feedback will always welcome
Thank you for your time.
The information contained herein is not intended to be a source of advice or credit analysis
Regards,
Walter

EUR/SEK : PRICE ACTION 4H TMF + HARMONIC BAT 🔔
Analysis of #EURSEK
If you have found this useful then help us support my page by hitting the LIKE button.
If you are not subscribed yet then please feel free to follow my page for daily updates and ideas. Thank you
It means a lot to us!
***
Strategy: Bullish BAT on H4 timeframe - We will be waiting for all the confirmations to enter in this trade.
A clear chart is Always the best business card for a trader.
***
Your support and feedback will always welcome
Thank you for your time.
The information contained herein is not intended to be a source of advice or credit analysis
Regards,
Walter
EURSEK for a new test of support 🦐EURSEK after the double bottom on the weekly support retraced inside a bear flag.
According to Plancton's strategy,if the condition will be satisfied we can set a nice short order.
–––––
Follow the Shrimp 🦐
Keep in mind.
🟣 Purple structure -> Monthly structure.
🔴 Red structure -> Weekly structure.
🔵 Blue structure -> Daily structure.
🟡 Yellow structure -> 4h structure.
⚫️ Black structure -> >4h structure.
Here is the Plancton0618 technical analysis , please comment below if you have any question.
The ENTRY in the market will be taken only if the condition of the Plancton0618 strategy will trigg

EURSEKI draw a couple of trendlines on diffrent time frames. Price touched my upper bollinger bands. So it might brake my trendline and make retest before falling to fib level 1.272


EURSEK Watch it for continuation to the downsideHi traders,
Keep your eyes for short term selling then watch bottom. If the price will keep giving you the sell setups and aggressive move to the downside stick to it. If the price will give you a strong price action from previous bottom then watch for one more wave to the upside ( follow the arrows) .


EURSEK: Descending triangle, formingDescending Triangle
Pros:
Descending volume during formation
Volume increase but no break out yet
RS flat and below 0
ATR flat
R/R ratio above 14
PPS below 50MA and 200MA
200MA descending
250RSI below 50
Cons:
If confirmed:
PT1 = 10.011$
PT2 = 9.721$
PT3 = 9.449$
PT4 = 9.284$
