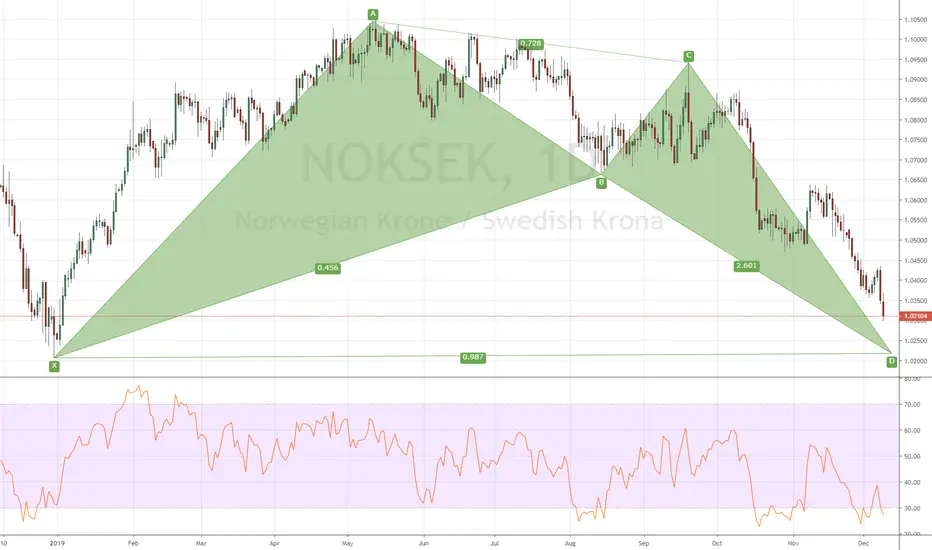
NOKSEK SHORTI apologize for the inactivity! We're back with new analysis. Price has been on a consistent downtrend trading below all EMA's indicating we should be looking to short. On the weekly and daily, price is sitting at key resistance. In addition, price was overbought till it started pushing downwards. More so, Price is sitting at the 50-61.8% fib zone and has just broken the neckline of the head and shoulders.
SEKNOK trade ideas

Trading Room Summary 21/04/20WTI Oil Futures hit below zero over night but have recovered to $20 will this be a catalyst for a stock market sell off? If so look for safe havens to push long especially against oil producers. This is already happening but whether it continues is the big unknown.


NOK/SEK LONG-Norwegian Central Bank stated would step in to FX markets if drop in Norwegian Krone dropped more.
-Providing support.
-At the same time oversold on the RSI and general sell down. Looking like a bounce.

NEK/SOK Bullish upwards-Norwegian Central Bank came out stating will intervene in the FX markets during the NOKSEK drop.
-Held up by this support.
-Plus oversold on RSI level.
-This should go up near term.


Bearish Gartley on $NOKSEK H4 & Bearish Butterfly on $NOKSEK H1 H1: Entry range 1.05325 to 1.05325, target 1.04952
H4: Entry range 1.05264 to 1.05917, target 1.04455


NOKSEK - Testing an important levelID: F139018448
Trade idea from our algorithmic system.
---------- Chart Drawings ----------
Blue Dotted Line: Broken Support Trendline
Red Dotted Line: Broken Resistance Trendline
Blue Solid Line: Support Trendline
Red Solid Line: Resistance Trendline
Blue Rectangle Box: Support Level
Red Rectangle Box: Resistance Level
Blue Arrow Line: Bullish Divergence
Red Arrow Line: Bearish Divergence
Red Shade Box: Suggested Stoploss by our algorithmic system
Green Shade Box: Suggested Stoploss by our algorithmic system
Good Luck!

NOKSEK Perfect Sell!Hi, everyone!
FOREXCOM:NOKSEK is near a very hard resistance, and just re-tested 1 broken trend line and a resistance level, and now going down!
SELL
TP(1): 1.05350
TP(2): 1.03240
TP(3): 1.00
SL: 1.0715
Those are long term targets
Don't forget the risk management
And Don't forget to leave a LIKE :)
#KeepGreen
Good luck

NOKSEKPossible failure to gain on NOKSEK also showing bear divergence on the daily.
Targeting support in cyan.
Trade Safe!


NOKSEK POTENTIAL SELL AREA DEDECTEDLooking at the chart, we can see a potential sell area between: 1.07683 / 1.06777, with a SL above: 1.07683 and a TP#1 area between 1.02801 / 1.01963 where I recommend closing 50% of your initial tradesize to give the TP#2 area "air to breave" and give you potentially more gains in the area between: 1.01041 / 0.99697
Follow if you like this ideas! check out my other ones too! ^^

38.2% & POSSIBLE 61.8% Retracement SHORT GWAVE38.2% & POSSIBLE 61.8% Retracement SHORT GWAVE.
FIB Retracement Percentage is calculated in a Higher Cartesian and or Euclidean Dimension.
PLEASE ALWAYS WAIT FOR STOCHASTIC CONFIRMATION!!! THANKS


A lot going on on the Daily chart at the 1.0500 level A lot going on on the D1 chart at the 1.0500 level
Price at round number 1.0500
Break and retest of major trend line (see monthly and weekly chart)
50D EMA nearby
Daily (classic) pivot nearby
Daily MACD is Bullish
Double top on weekly chart
Monthly and weekly chart show break down and retest of lower line bearish ascending triangle. Needs retest and confirmation of trend reversal
One to leave for the weekend and watch next week.


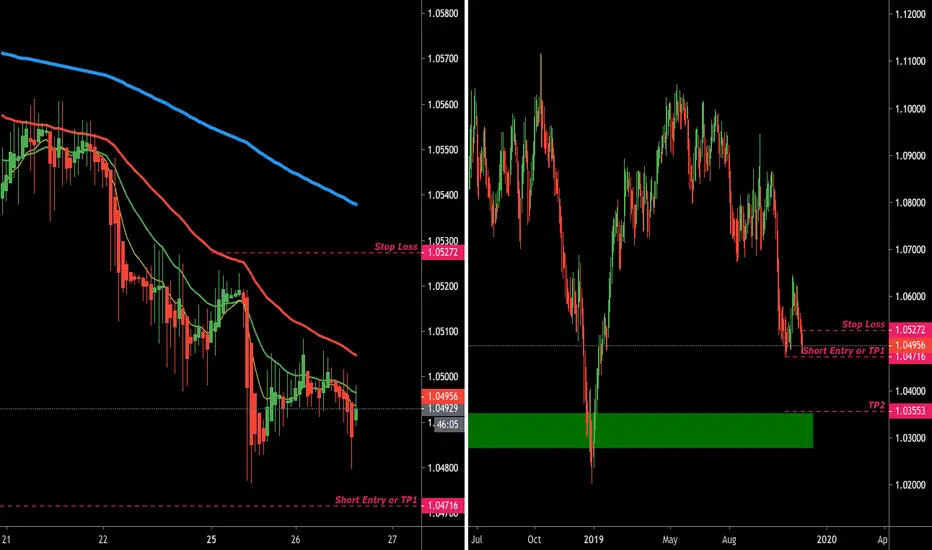
NOKSEK: Sell Stop order below 1.0471 Trend Continuation: Entry criteria met on H1
An aggressive way would be short immediately with TP1 around 1.0471.
A less aggressive way which I would be trading is placing a sell stop below 1.0471 targeting 1.0355 as TP1