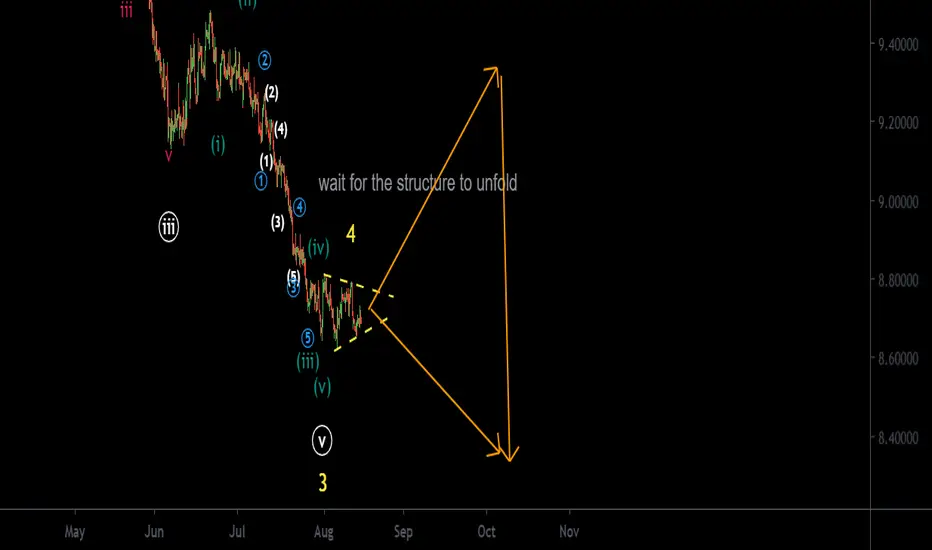
USD/SEK Elliott wave analysis for week starting 24.08.2020I am still so bearish on this but we are on wave 4 correction, might be long
I am not expecting the price to go higher than the box, if it does It might raise a warning
SEKUSD trade ideas

USDSEK - LONG TERM BEARISH TREND LINE MET AGAIN !bearish pin bar at trend line resistance, put stop loss above wick and target recent daily lows.


Sell PotentialBrke out to the downside of a wedge formation pattern after a doji indicating reversal. May be a false breakout


USDSEK ranging for a possible retracement 🦐USDSEK is close to a weekly resistance.
Market is currently renging between 2 structure and after a long bear move there is the possibility to see a retracement.
Price currently broke the inor channel and is testing the support structure.
IF the market will break and close above the weekly structure, at the restest of it, we can set a nice long order according with Plancton's strategy.
–––––
Follow the Shrimp 🦐
Here is the Plancton0618 technical analysis, please comment below if you have any question.
The ENTRY in the market will be taken only if the condition of Plancton0618 strategy will trigger.

USDSEK Elliott wave forecast for week staring at 17.08.2020Hi all,
It is a boring Saturday for me and I had nothing to do so lets do a minor currency pair for fun:D
First of all I am not 100% sure about the wave counts as I didn't go through 1min chart to verify all the counts but it seems to be a good count
2- some of my wave counts doesn't 100% confirm the fibo ratios but it is roughly a correct model I think.
it seems that we are in wave 4 and we should expect some reverse.
I think we are gonna see a triangle. wait until one of the trend channels for the correction to get broken so I can see clearly what structure is this.
buy or sell?
non, just wait . I will keep you update under this post
I am so bullish and I think we will see some reversal but I am not gonna buy until I see a clear signal

usdsekpast times the usd has fallen it has been a rather long process, however, these past 6 months things have moved much quicker. not sure what that means in the long run, but it's an interesting thing to consider if you are a SEK holder

USDSEK Long Weekly 8 EMA GapWe have had a strong down trend on this pair. I believe that this week we might see a GAP close on the weekly 8EMA
Will wait for BCR of 50 EMA ON THE 1H TF before I take the trade
Comment: Disclaimer: I am still new to trading and testing my strategies. Not all trades Ideas I post will result in live trades. The might be tested on demos accounts.
Please share your Ideas with me and I am always open to positive criticism.
Remember to use risk according to your appetite.
Thanks for Checking out this Idea.


Technical analysis and trendline and chartpattern analysis......#USD/SEK make a Rising wedge chart pattern with
small bear flag . make a short opportunity.


USDSEK double bottom set up. DXY Pullback?USDSEK on the 4 hour has been in a major downtrend with multiple lower highs and lower lows. We hit a major support zone on the daily chart at 8.6000. From here the downtrend is beginning to exhaust with no new lower lows.
From here, it seems we are setting up for a double bottom pattern. A quintessential reversal pattern. I am awaiting for a break above the flip zone at 8.80. I want a nice and concrete candle close above. Wait for that close! We could easily get a reversal and a pinbar candle.
If we get that break, expect multiple higher lows on the way up. We have a major zone at 9.10 which I would target.
Speaking about USD pairs, take a look at the DXY. Also a possible double bottom pattern which NEEDS the breakout to confirm. Will we get it? We shall wait and see.
If we do, it could be a pullback to the 95.00 zone before making a second lower high on the daily chart.
Here are a few USD pairs that have similar set ups:


