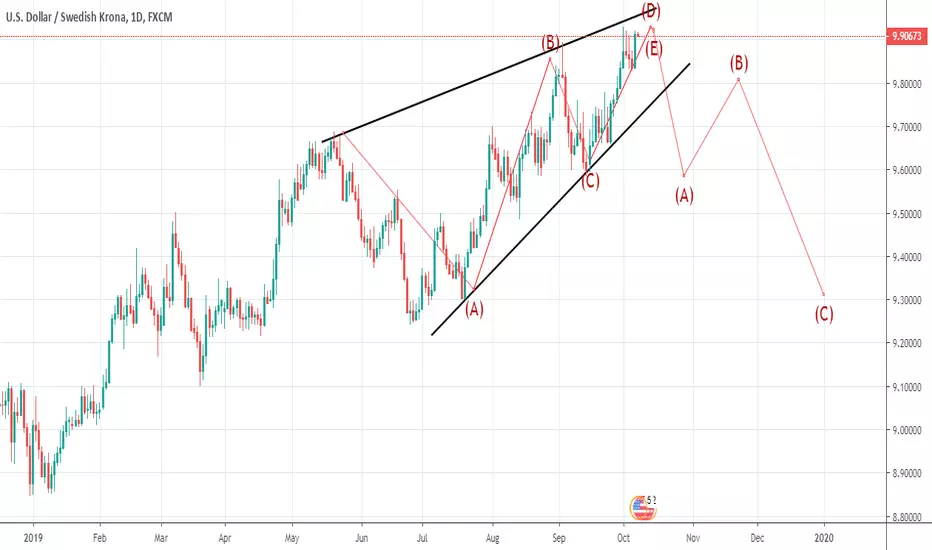
Potential bullish reversal Usd SekPotential bullish reversal in Usd Sek daily, tricky because it has potential for bulls to spike up and also for bears to go down, market is clear to me right now but, - bearish interests.
SEKUSD trade ideas

USDSEK bounced from support, potential for a further rise!
USDSEK bounced off 9.77200 where it could potentially rise further to 9.98200.
Trading CFDs on margin carries high risk.
Losses can exceed the initial investment so please ensure you fully
understand the risks.

USDSEK bounced from support, potential for a further rise!
USDSEK bounced off 9.77834 where it could potentially rise further to 9.87290.
Trading CFDs on margin carries high risk.
Losses can exceed the initial investment so please ensure you fully
understand the risks.

USDSEK bounced from support, potential for a further rise!
USDSEK bounced off 9.77834 where it could potentially rise further to 9.87290.
Trading CFDs on margin carries high risk.
Losses can exceed the initial investment so please ensure you fully
understand the risks.

USDSEK SHORT - POSSIBLE 400-500 pip move!!Due to my analysis you can see price has reached the top of the Bollinger band, that means price has came to a certain resistance in the market. Besides the Bollinger band price has been moving with the trend it has created, which has been bullish. Since it reached the top of the trends resistance and top of the Bollinger we will go for a sell to about where last resistance was which is now support.

USDSEK bounced from support, potential for a further rise!
USDSEK bounced off 9.81765 where it could potentially rise further to 9.97717.
Trading CFDs on margin carries high risk.
Losses can exceed the initial investment so please ensure you fully
understand the risks.


USDSEK - 240 - Quick shoutout before Swedish CPIsTrade idea
Watch the possible breakout levels, which are highlighted. If the pair breaks to the upside, our target is the psychological 10.0000 barrier. If the pair drops through the lower highlighted area, this could signal a change in the short-term trend.
Please see the chart for details. Don't forget your stop-loss.

USDSEK - Potential Long if CPI Disappoints!SEK Inflation data due shortly.
Given the recent PMI data, we are expecting
a worse print, which would catch the market
off guard and send USDSEK higher.
EURSEK is also another consideration for the trade.
Enter AFTER the data - do not anticipate.

USDSEK reversed from resistance, potential drop!
USDSEK reversed off its resistance at 9.97717 where it could potentially drop further to 9.83895.
Trading CFDs on margin carries high risk.
Losses can exceed the initial investment so please ensure you fully
understand the risks.

USDSEK approaching resistance, look out for potential reversal!
USDSEK is approaching its resistance at 9.97717 where it is could reverse down to its support at 9.83895.
Trading CFDs on margin carries high risk.
Losses can exceed the initial investment so please ensure you fully
understand the risks.


USDSEK arriving to exhausted level-Be ready to contra trend USDSEK in its uptrend is showing the first signs of debility...
We should wait until confirmation.
Beware, today the uptrend is still valid.
Be ready to execute any contra trend strategy to trade shorts for some pips...

USDSEK turned bullish - LongThere's a bullish channel within a bullish channel that I see happening here, (shortened higher and lower diagonal green lines), and candles have strong suggestive bearish wicks -but, this is a Bull market.
Low volatility close to being motionless, best followed in Heikin Ashi, -and if price falls below the secured 9.82990 lower high, then the setup will be invalid.

USDSEK reversed from resistance, potential drop!
USDSEK reversed off its resistance at 9.92718 where it could potentially drop further to 9.83895.
Trading CFDs on margin carries high risk.
Losses can exceed the initial investment so please ensure you fully
understand the risks.


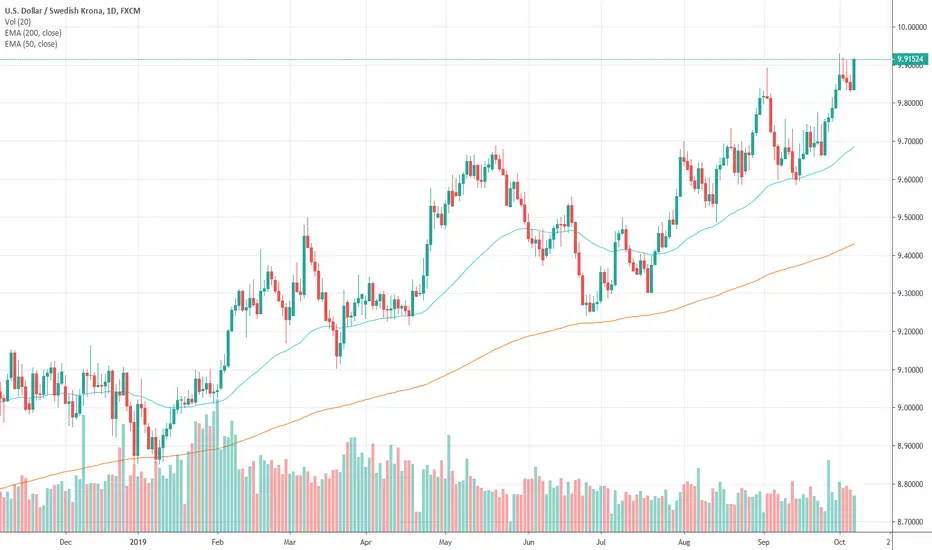
Swedish krona continues to sufferThe US dollar has risen again against the Swedish krona, testing the 9.9 level during the day. We are well above the 50 day EMA, and now threatening to make a fresh, new high again. Ultimately, this means that the market will probably go looking towards the 10 SEK level, an area that will of course attract a lot of attention as it is such a large, round, psychologically significant figure. That being said, the fact that the Monday candle is closing so strong suggests that we are going to get that follow-through.
With the US dollar strengthening the way it is, that could be a very “risk off” signal, showing signs of the market becoming concerned about riskier currency such as the Krona. The 9.80 SEK level underneath should be support, and at this point the uptrend is showing no signs of letting up. That being said, the 10 SEK level is an area where I would expect a huge pushback, as it is a large, round, psychologically significant figure and of course an area that the market has seen.
If we were to turn on a break down below the 9.80 SEK level, then the market probably goes looking towards the 50 day EMA underneath, closer to the 9.70 level. That being the case, it’s most likely a market that you are waiting to buy instead of trying to sell into that move. After all, the trend would still be very bullish, so trying to fight it would make any sense. It is not until the daily candle stick closes below the 9.6 SEK level that the trend would be threatened. Until then, it’s simply a matter of buying dips as they come along but based upon the Monday candle stick, we may not even get a chance.
USDSEK ShortThe USDSEK is comming down from its highest reading in 17 years.
On Daily we have a pinbar followed by doji and then a clear bearish bar. On Daily the RSI is just about to cross the MA9 also.
On 4h we have a decending triangle into support. Loss of momentum, the very high reading it is coming down from and the structure suggest a break of the support - but still confirmation is needed.
The target should be around previous structure meeting the MA100 at around 9.75000

USDSEK reversed from resistance, potential drop!
USDSEK reversed off its resistance at 9.84982 where it could potentially drop further to 9.80747.
Trading CFDs on margin carries high risk.
Losses can exceed the initial investment so please ensure you fully
understand the risks.

USDSEK short @ 9.85436 stop @ 9.9737 target 9.7355 2nd position if it moves against me will be @ 9.8770
Always know that if I post a trade I am in it. There is no trade I post that I am not in.

USDSEK ShortSold USDSEK on the 2h after the break of a triple top at a supply level. (2h is usually the lowest timeframe I will trade on)
If you haven't noticed already - my method is simple - wait for price to get to a major supply or demand area and then wait for it to form a pattern and break the pattern to confirm my entry.
Funny enough, the entry is the LEAST important part of my trading. It's taken me 3 years to realize that managing my risk and my money is the MOST important part.
Anyway, let's see how it goes!
