USD/SEK 1H Chart: Rate tests 55-day SMAUpside risks prevailed in the market at the beginning of July, thus sending the US Dollar 3.10% higher against the Swedish Krona. Half of these gains were erased during the previous trading week, as the pair had returned near the 8.80 mark at the time of this analysis.
The Greenback has already fallen below the 100– and 200-period (4H) SMAs. If the 55-day one likewise surrenders at 8.7950, it might be considered that a medium-term decline is in sight.
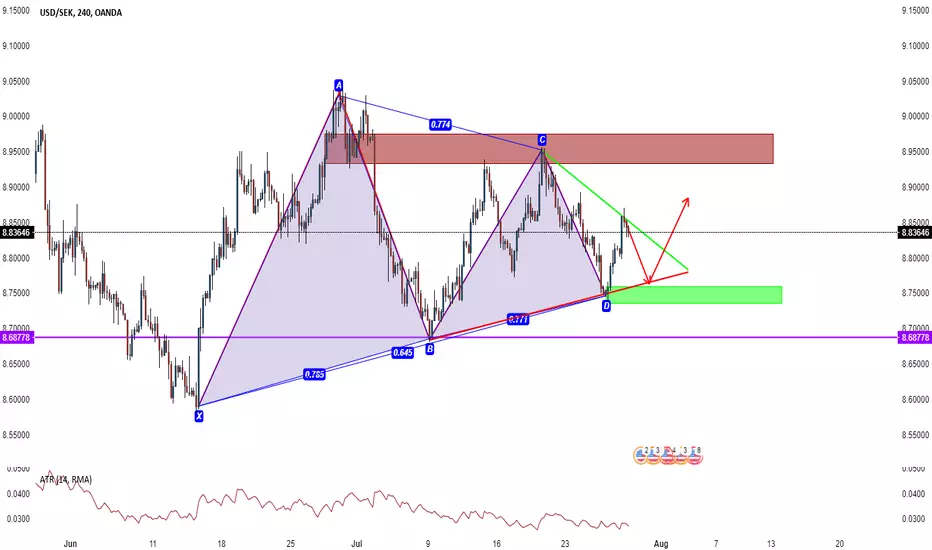
The following trading days are likely to come with a slight correction north until the monthly PP and the 55-period SMA at 8.85, as bears could lack the necessary momentum to dash through the 55-day SMA at first. This up-move might also lead the rate until a trend-line located near 8.92 is reached.
SEKUSD trade ideas

Bearish Butterfly on $USDSEK H4Entry range: 9.0941 to 9.3112, stops above high. Targets: 9.0335 and 8.8423

USD/SEK only for option trading ...This is only for option trading ...
from 23.30 to 00.30
1 hour candle will be red....
please wait for active trade below


don't forget SEK: short it by cypherhello, if you still want to do usd short trade, I recommend USD/SEK
SEK is going to rise interest rate in this year, usd/sek keep touching the long-term gmma. The width of GMMA is become smaller, suggest that the trend is likely to change
also there is cypher pattern in it with prefect risk-reward ratio
you can check the related idea below
click the like button if you love us

38.2% & POSSIBLE 61.8% Retracement LONG GWAVE38.2% & POSSIBLE 61.8% Retracement LONG GWAVE.
FIB Retracement Percentage is calculated in a Higher Euclidean Dimension.
PLEASE ALWAYS WAIT FOR STOCHASTIC CONFIRMATION!!! THANKS


Rectangle continuation on 1D. Short.USDSEK continues to trade inside a long term 1D Rectangle (ADX = 15.631, Ultimate Oscillator = 49.902) and we can continue working within the yellow rays on a medium term scalping approach. For now we are shorting, TP = 8.64012.

Pivotal swing after engulfing = Low risk high probability tradeTrading the weekly OANDA:USDSEK swing from the pivot midpoint. The h4 printed an engulfing candle right at the pivot midpoint. As I am still mildly bullish on the USD buying is the game with 8.98 as a first target.
Let's see where it brings us. Trade safely

38.2% & POSSIBLE 61.8% Retracement LONG GWAVE38.2% & POSSIBLE 61.8% Retracement LONG GWAVE.
POSSIBLE E7 GWAVE Euclidean Structure.
FIB Retracement Percentage is calculated in a Higher Euclidean Dimension.
PLEASE ALWAYS WAIT FOR STOCHASTIC CONFIRMATION!!! THANKS

Going Long USDSEK While Awaiting for Dollar Bear to ResumeSome pairs, such as USDMXN have falling more than 3% over the past week, but the USDJPY pair is hesitant to fall do to several economic reasons.
While waiting for the USD bear market to resume, I have placed an order to buy USDSEK in the up direction. The most ideal stop would be placed under the previous daily low of support at 8.5700, but I don't want to stay in the trade that far should the trade go against me and the dollar suddenly continues to shoot down; hence, a smaller stop on the chart, and a smaller target to what I believe is an equilibrium price if USDSEK decides to move up or overshoot.
Further technical reasons:
(1) Stochastics oversold
(2) Momentum bullish
(3) RSI at extremes and bullish
(4) Harami Japanese price pattern called a doji reveals hesitation of the previous bear swing to continue, and a bullish swing is pregnant, but it could lose its pregnancy although the sign is there, which is why I don't want to hold to the 8.5700 swing low. I'd rather just get out if the bear swing continues.

SHORT 38.2% & POSSIBLE 61.8% Retracement SHORT GWAVE38.2% & POSSIBLE 61.8% Retracement SHORT GWAVE.
POSSIBLE E7 GWAVE EUCLIDEAN STRUCTURE FORMING.
FIB Retracement Percentage is calculated in a Higher Euclidean Dimension.
PLEASE ALWAYS WAIT FOR STOCHASTIC CONFIRMATION!!! THANKS


USDSEK Bullish BiasLow Risk High Reward Trade.
Not for market chasers.
Entertainment Purposes Only
Reasonable SL at 8.94961 and TP at 9.02254

USDSEK, too tasty to avoidprice right into a supply level following the immediate double top and a crash.
High probability short, targeting the immediate resistance turn support zone?


USDSEK: Rectangle on 1D. Short.USDSEK is trading near the 1D Rectangle's Resistance. It may rise to 8.97077 but eventually should test the 8.56621 support if the 8.98828 resistance stays intact. We are taking a short action: TP = 8.64012.

USDSEK BREAKOUT PULLBACKPullback to the breakout trend-- First target is 8.57362
Also is the beginning right shoulder of a head and shoulders pattern.

USD/SEK 1H Chart: Upper range line reachedThe US Dollar has been stranded in the 8.5675/8.9835 range since late April. Its southern boundary and the senior channel were tested mid-June. This move was followed by the Greenback initiating a new up-wave and reaching the 161.80% Fibonacci expansion line at 8.95 yesterday.
Given that the pair has reached the upper range boundary, it is likely that bears start to pressure the rate and thus push it lower. This assumption is likewise strengthened by the fact that the rate has breached the dashed short-term trend-line.
The base scenario favours the weakening of the strong upside momentum and a soon decline down to the 55-, 100– and 200-period (4H) SMAs or the other range line at 8.75 and 8.5675, respectively.

USDSEK WEDGE -- BREAKOUT PULLBACK SHORT Was waiting for this setup to form and it turned out perfect. Nice .618 retracement coupled with a beautiful shooting star, and also a wick touch against resistance.
Short Term Goal of 8.53066
