Emerging market currencies to outperform G10 in 2023With the global economy showing more resilience and the Fed slowing its pace of tightening, we believe EM currencies can outperform relative to G10 peer currencies this year. Attractive real yields should result in market participants accumulating exposure to developing currencies, while our assumption for contained banking sector stresses should lead to improved risk appetite.
SEKUSD trade ideas

USDSEK Failed Break Down. Return of the dollar? So, have you been keeping an eye on the USD/SEK pair lately? It's been pretty interesting to watch. Even though the FOMC meeting had an impact on the pair, it didn't completely break down. In fact, there's a buy signal on the daily Stochastic, which suggests that the pair could be turning bullish.
What's even more exciting is that the USD/SEK pair is currently trading above the trendline that began on January 23. This is a good sign for those who are bullish on the pair.
So, what does all this mean? Well, it looks like the USD might be making a comeback against the SEK. It might be a good idea to take a long position in the pair, with a stop-loss set below the trendline for protection.
Of course, as with any trade, it's important to keep an eye on the market and adjust your position accordingly. But overall, it looks like there could be some potential for profit here.

How to close out the Trading week 1,000 Pips Caught (USD/SEK)This week New was the beginning of the great volume I've missed seeing in a while trading USDSEK in 2023 Currency markets.
The last three trading days have been Short trades during London session and U.S. session conversion which led to three consecutive trading days shorting during this time.
Instock traders :Jrow in this scenario have put himself in great positions this week trading successfully.
Trader IG: Jrowbee
Trading Co. IG: INSTOCK247365

USDSEK sellMarket has broken below the horizontal line suggesting that price action is due for a temporary reversal of the most current bullish push. Market bias is short term Sell.. Target is shown

Sunday USD Currency outlook Market analysis of currency markets.
The Main driving force of the U.S. Dollars currency is the DXY symbol, this; U.S. dollar Currency Index is the base of one of the most powerful currencies in the world.
In this video Instock Chartist Jrow demonstrates how a Sunday at the office with a view overlooking Southside Wal streets firms Currency sector.

USDSEK Trading The Corrective CycleIn this update we review the recent price action in the USDSEK and identify the next high probability trading opportunities and price objectives to target

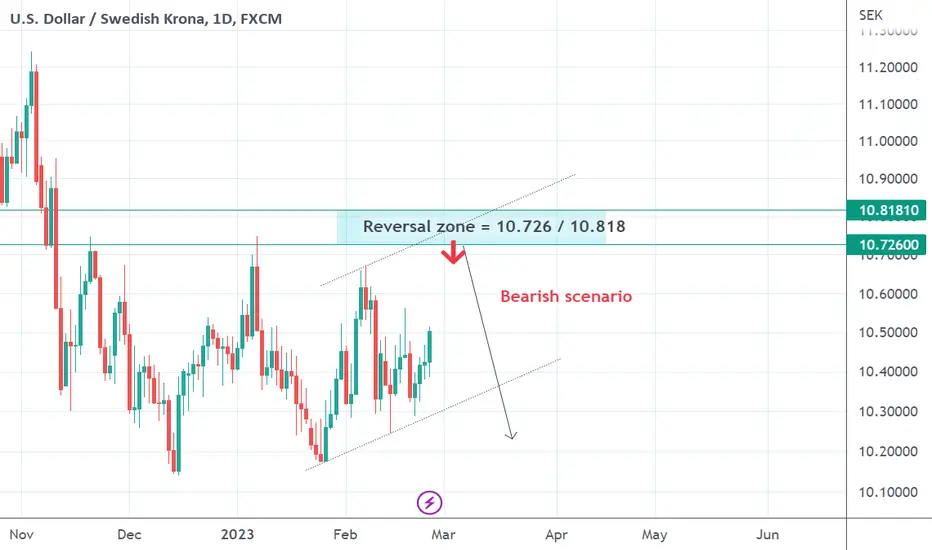
USDSEK: Possible reversal around 10.7USDSEK is likely to pull back if the pair moves higher near 10.72. As long as USDSEK trades below 10.818, the outlook remains bearish within the first half of 2023.
Resistance zone = 10.726, 10.748 and 10.818
USDSEK: Elliott wave triangle is pointing down Despite some slow down of inflation in Sweden, this one looks to be ready to break down from a triangle soon. If FED dissapoints to bring more hawks after US PCI miss last week, I think this one can easily break down into a fifth wave.

LOOKING TO GO SHORT ON USDSEKWe can see price came down impulsively and begins to range, (bear flag formation), will look for an entry on the third touch on the resistance of the flag for short

USD SEKThe analysis shows that a 3-wave correction is forming
We will explain better in the analysis update in daily time up to 4 hours

USDSEK Price forecastingUSDSEK price action has completed two touches on a potential expanding formation whilst forming a structure within in the form of an ascending channel. The potential third touch on the ascending aligns with the potential third touch on he outer expanding structure..Will be watching price action closely for potential shorts .

USD Forex Market analysis From Jrow Instock Trader !!The trend of The USD in heavy relation to USD Economy's Strength and direction.
Forex Currency pairs: USDCAD, USDJPY, USDDKK, USDSEK Follow the lead of the DXY; U.S. Dollar Currency Index
The USD has Been In a Bearish Trend Since September 28th, 2022.
The floor of this trend has not been yet identified and confirmed with high timeframe rejections.
TVC:DXY

USDSEK: Bearish ABCD Visible on the MonthlyThis ABCD could be looked at as a bit of a double top too but i would target the C level for both in this short.

USDSEK - Let's sit & wait...USDSEK - Let's sit & wait...
Most favourite plan to do on the weekend is my weekend analysis. The market is close, going through higher TF, getting into the zone and ready to crush another week of trading!
USDSEK - Another trading pair I occasionally trade. I feel the behaviour of SEK is very interesting, i'd say I do trade relatively small on this pair but the risk/rewards are great. For now we are waiting for a break to either direction and this is a similar theme on all FX pairs I am looking at. When the market are these conditions I usually add alerts and perhaps limit orders.
Key Tip: Don't forget to follow your trade plan and if you don't have one MAKE ONE!
Trade Journal

Trend Analysis from Instock For Instock By Instock and for traders to get Familiar with Identifyng Market Trends.


short entryBearish
1.bearish trend
2.descending trend line as resistance
3.Broke major support
4.Bearish engulfing


USDSEK BULLISH REVERSAL WEDGE PATTERNUSDSEK Bullish Reversal Wedge Pattern formation. Entry on basis of breakage.

USDSEK bullish continuationHere we have a great zone in the RSI for accumulation of the long position. The blue box on the RSI has held since May 2021. Not fading this move yet. I predict bullish continuation for this chart. Perhaps the price will fall below support, but until we see a bearish regime change on the RSI, this trend continues.

NFP !!!!!!!DXY WEEKLY breakdown, daily, 4h, and trades on the 1 hour and 30,15 minute time frames. London session and with the NFP news release.

long entryseries of HH and HL
formation of Bullish harami candle
indicates a new HL with a long entry

usdsek usdsek is going on taking support trendline now it get reject from its previous and ath high so lets seeeeeee
