Sensorium (SENSO) / BTC - A rewarding candlestick patternThe pattern of candles highlighted is a favourite of mine. You don’t often see such a clear example in the charts, but when you do..
If you’re new to trading / active investing, this is one to put in your notebook. No matter the chart study, stocks, crypto, price of fish cakes in Hong Kong, it wor

SENSOBTC longIf you find my market analysis interesting then please like and follow me to keep up with my latest analysis. Thanks for watching. good luck

Sensorium <SENSO/BTC> - (Local Resistance Breakout)💎Technical Analysis Summary💎
KUCOIN: SENSO/BTC
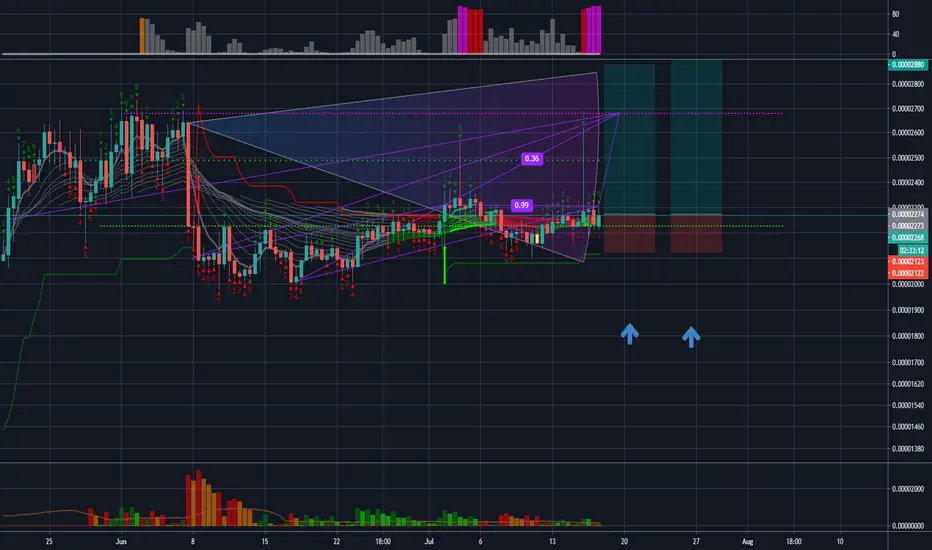
-SENSO broke the local resistance around the 2300s sat
-This signals a strong buying presents by the Bulls
-We have seen multiple green candles on the daily chart
-The Bulls are trying to build up a momentum
-Most of the time, a healthy uptrend cons

SENSO SENSO has formed the triangle chart pattern near the upper boundary of the channel. There is the key resistance zone near 2600 and the key support level — 2020.
I have recently come across SENSO, an ERC-20 token used as the in-platform currency of Sensorium Galaxy — the multi-user social VR platfor

Sensorium <SENSO/BTC> - (Potential Bullish IH&S?)💎Technical Analysis Summary💎
KUCOIN: SENSOBTC
-SENSO bounce off at previous two support zone last May-June history
-We can also see a potential Bullish engulfing candle today if finished strong
-This is a strong sign of Buyers are ready to jump-in at key areas
-On the Technical pattern side, it

Sensorium a new hope (for a new entry coin)It keeps making candles (some with big volume ,as wicks) above the resistance 002222
We need to break 2686 resistance first !
See all ideas
Summarizing what the indicators are suggesting.
Oscillators
Neutral
SellBuy
Strong sellStrong buy
Strong sellSellNeutralBuyStrong buy
Oscillators
Neutral
SellBuy
Strong sellStrong buy
Strong sellSellNeutralBuyStrong buy
Summary
Neutral
SellBuy
Strong sellStrong buy
Strong sellSellNeutralBuyStrong buy
Summary
Neutral
SellBuy
Strong sellStrong buy
Strong sellSellNeutralBuyStrong buy
Summary
Neutral
SellBuy
Strong sellStrong buy
Strong sellSellNeutralBuyStrong buy
Moving Averages
Neutral
SellBuy
Strong sellStrong buy
Strong sellSellNeutralBuyStrong buy
Moving Averages
Neutral
SellBuy
Strong sellStrong buy
Strong sellSellNeutralBuyStrong buy
Displays a symbol's price movements over previous years to identify recurring trends.