Rising WedgeADBE beat earnings a few days ago...yet the stock is going down? Possible Parabolic Arc. Strong stock so perhaps it's bottom is not too far away
Rising wedge patterns can be bearish as there are not enough pull backs. I was trying to draw support lines but it was difficult to find several daily candles in a row as it seems ADBE never pulled back long enough to form support.
The bottom trend line of the wedge is at 430ish and sometimes they find support there. It will most likely pierce this level though and could go down quite a bit more. 413ish to 383ish may provide support. Break out level for the prior V Bottom may also provide support
Irrational exuberance causes Parabolic arcs and rising wedges
The trend is your friend until it is not
Not a recommendation
ADBE06 trade ideas

ADBE setting off long term sell signalAdobe had some amazing Q3 results, but it was not enough to stave off the powerful technicals of a waning RSI and a steep upwards trend that was destined to correct. This one looks like its going down to at least $430, but will be a buy between $363 and $396

ADBEADBE trading inside an upside channel since March bottom. Have more than 10% potential profit with 5% stop on 460$. 1:2 profit ratio
Reporting tomorrow so extra care should be taken.
Good luck.


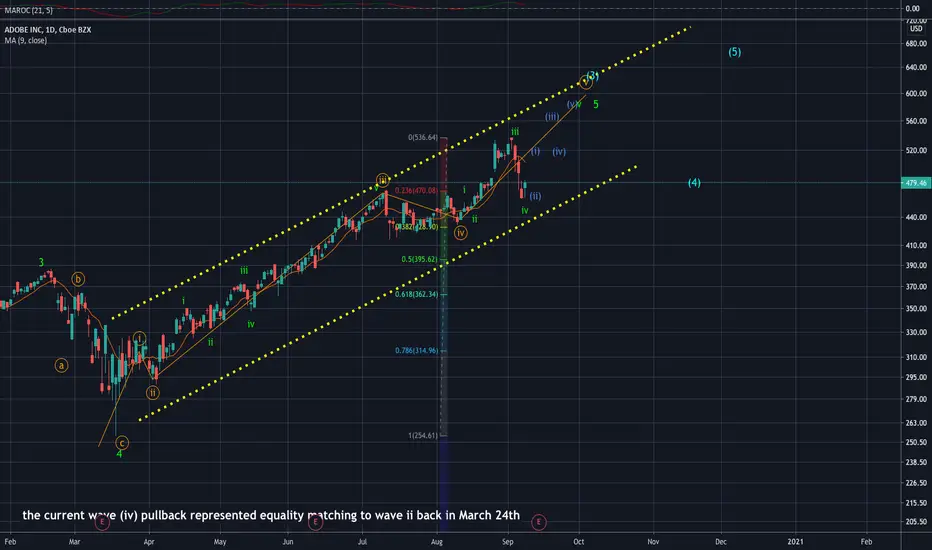
ADBE Wave (5) Bullish On the Daily time frame, ADBE pulling back into wave (4) support level at 460 likely setting up wave (v) rally same degree measured move targeting the 600-610 level. Potential ending diagonal pattern if wave v bullish into 560 upside is complete
daily analysis of ADOBE INC Hi friends
the daily chart of this market shows that it will experience an uptrend in the next few days but it is better to be careful of the change from the direction of the market to the opposite direction
please subscribe to receive more analyzes


ADBE - 12.52% Potential Profit - Corridor BreakoutCorridor Breakout out of a 1-month price correction. Strong possibility to hit the uptrend resistance line.
Target price set at resistance line bounce.
- Historical Uptrend
- RSI and STOCH well above 50
- MACD well above Signal
Suggested Entry $467.15
Suggested Stop Loss $456.41
Target price $525.55
Note that I tend to adjust stop losses in order to secure profits early and preserve capital. This means that the target price is going to be achieved as long as there are no strong pullbacks that trigger my new adjusted stop loss.

ADBE $ADBE
ADBE has been on a bullish run since earlier/mid August. On the 10 minute (left) my omni bands are squeezing, indicating a bigger move. Personally, I think ABDE still has more room to grow as long as we hold above 510.
Bullish above 518, price target 524-526
Bearish under 513, price target 508-510
Breaking above and holding over 518.5 and we'll retest ATH near 532-533.
On the downside, breaking under 507 support and we'll pullback to 496 then 480

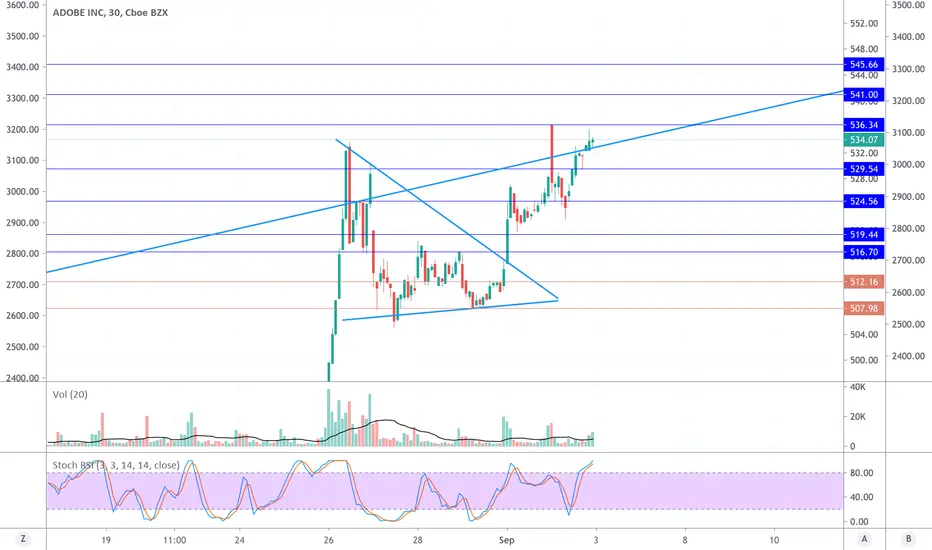
Consolidation/Flag$ADBE (1h) is consolidating after the most recent squeeze. Forming a flag/triangle and close to its short Moving Average.
Waiting for some action on the next hours

$ADBE - Symmetrical Triangle breakout$ADBE
7Th August candle has more volume. Remaining red candles not much.
For green candles not very high volume but on breakout day 18th August volume is more or less near average.
Triangle breakout for possible 40$ move.
I will enter around 464 for a 25$ move with 14Th August low as a stop loss (near 21 EMA)
So in reality this is 1:1 trade. Not very great setup but safe.

pls give me feedback,fellow traders. i am new to this. ty:)price seems to be making steady upward consolidation with slightly higher lows each time
i am thinking it will continue in a similar fashion b4 pushing up
any feedback is greatly appreciated


Breakout or wait for pullback? Market leader with high RS.FA,
- Brilliant financial position and poised for growth
- Foremost stock with significant subscription revenue model.
- Market leader
- RS rating 88. EPS rating 99
- ROE:39%
- Sales growth 3Y : 23%
TA,
- Wyckoff Accumulation
- If price closes above 470, it's a clear sign of strength(SOS)
- Higher highs and higher lows. Supply drying up.
- MACD daily golden cross
- Through this whole rally, ADBE has never dipped below 40ema which further confirms it's high relative strength and the status of a market leader.
- Perfect entry would be if price can consolidate and get closer to 20 and 40EMA.
Risks,
- Overextended from moving averages
- Pressure on growth stocks

ADOBEHere might be a great deal, if it crosses and sustained above my trend line for some time !! (all levels marked) !


ADBE BUY OR LONG , TARGET UP TO $520+ADBE confirms the Symmetrical triangle pattern today, buy point is activated, I open Long.
ADBE buy : $465
ADBE target : $520+
Stop loss : 6%
Wish you a good deal

ADBE Bullish Trade Setup On the Daily time frame, ADBE consolidation is almost complete setting up for a likely wave (3) rally same degree measured move targeting the 560-599 level. I am interested in setting up medium term long position on ADBE with expiration into Oct-Nov 20’. Trade execution details in video update.


Strong But for an earnings run up! #tradeidea Long over $460already holding a position will buy some calls!

