NKE AnalysisPrice is on an uptrend, creating sell-side liquidity. Price has mitigated the bearish POI at 117.61 and is currently retracing to the downside. We are still on a higher timeframe downtrend. I'm expecting price to go lower and take out sell-side liquidity before going higher.
NIKE80 trade ideas

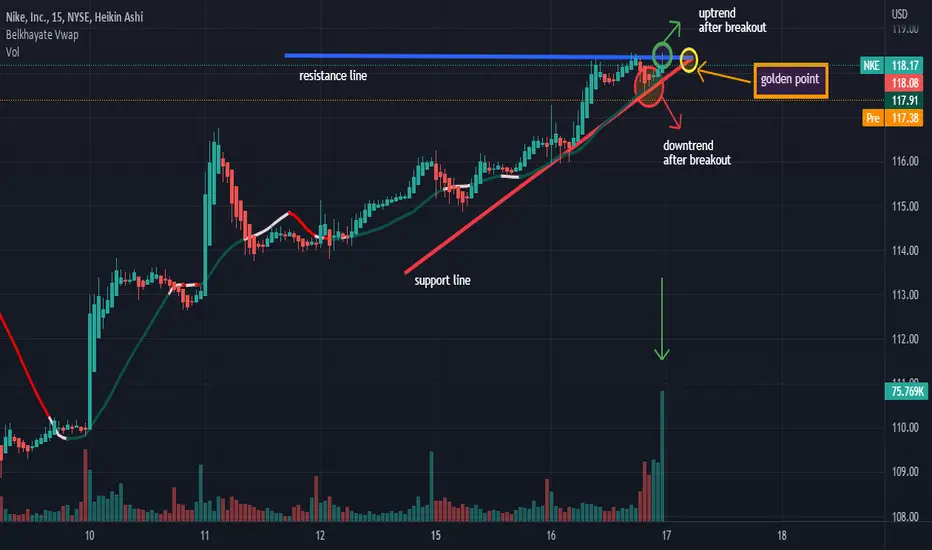
DowntrendHere after the breakout with force the vwap indicator by a big red candle with a large red volume we will have a big probability of a downtrend so you can sell at the next red candle. Thanks.


AnalysisHi! On this chart we are in an uptrend and we are not going against this trend. We will wait until there is the break of the support line and the vwap with strength by a large red candle followed by a large red volume to hope for a downtrend.
Moreover, we must not forget that we can also have a continuation of the trend if and only if the resistance line is broken with force by a large green candle and followed by a large green volume. Thanks.
NKE is ready for BO NKE is getting ready for good breakout. NYSE:NKE
*Not an investment or trade advice. Solely my own interpretation. I opened a position for NKE on 8/9/2022.

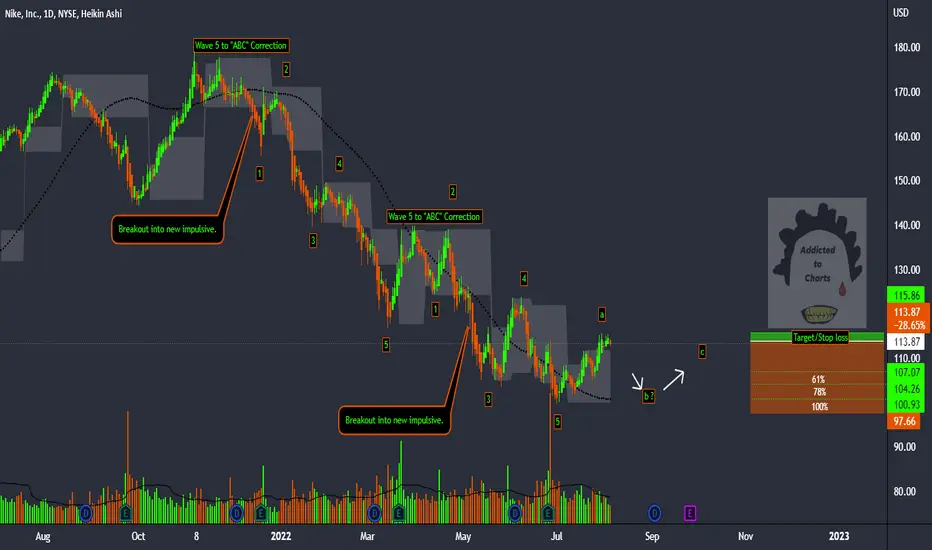
Nike (pullback to make double bottom?)Looks like we may be entering into a corrective state of market structure. We have recently finished our second 5 wave impulse being that we are on a downtrend currently. We have been dealing with a bearish rally filled with good news from the media while there are still battles ongoing with rumors of war, inflation , supply chain issues etc. I could keep going but you get the point. Smart money is still being strategic about the manipulation so I wouldn't get too bullish . If this corrective wave is true, we would like to see a pullback into the B wave which should start a range for the new "ABC" correction before judging the next breakout. We have our stop loss set at the high of wave a to be safe and our target are at the 61%, 78%, and 100%, to account for either a "regular flat", "irregular flat", or a "running flat". Not advice of course! Let's see how this plays out going forward.
Thanks for the support! Remember, the better you is tomorrow but the current days needs enough attention to get you there!
$NKE Buy Above $107.10 or Sell Below $ 101.50Buy Above $107.10
TGT 1- $114
SL: $104
Sell Below $ 101.50
TGT 1- $ 95
TGT 2:- $ 93
SL: 104

Bad Bunny Nike is having a a sponsorship h¿with probably the most famous singer, and since it's shoes are selling pretty high it, I would probably go long.

NIKE, INCA beautiful, very strong and powerful climb as he penetrated the good price channel and in case of closing it over it we can see it at the specific viewing area that is considered a target

$NKE Analysis, Key Levels, and Targets - REQUEST$NKE Analysis, Key Levels, and Targets - REQUEST
I have no position here… just doing an analysis for my friend @Dirty_Money88
Interesting. First thing I see right away is MacD curling up… on the weekly… BUT also remember that macD is way under the centerline so still bearish, but with a bullish twist… Sentiment has been getting lower week over week…
It looks like the 200MA was defended… and the MA’s are moving up….
I'd probably sell some puts around 20 delta around here... 😏

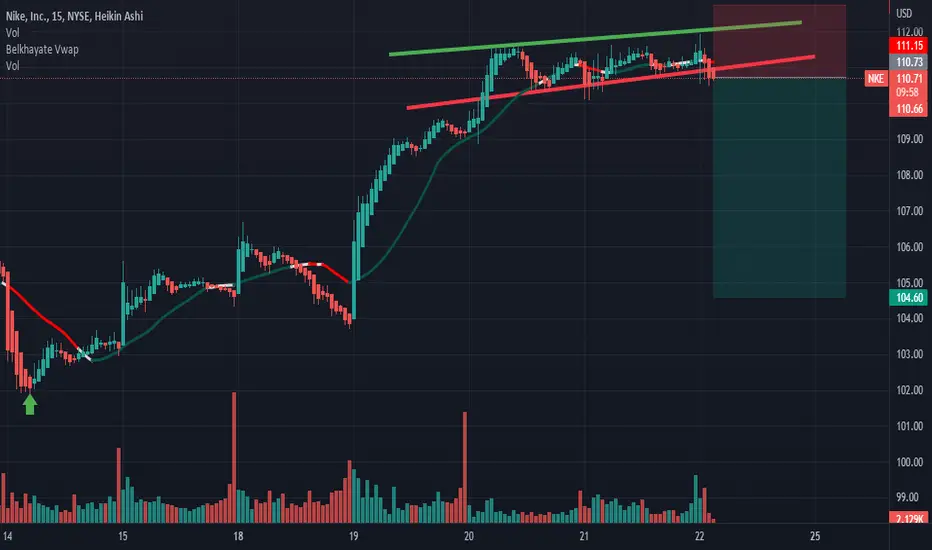
AnalysisHi! Here, we have a breakout as you see on the chart the resistance line so we will have a high probability of an uptrend.thanks.

Pulse candleAs you can see on the chart we have an impulse candle which has forcefully broken the vwap indicator, hence an uptrend with high volume support. Thanks.


AnalysisHello! As you see on the chart we will have a big probability of a downtrend if we have a breakout with force the support line by a big candle with a large volume because the support line is more important than the resistance line. But there may be a continuation of the uptrend if the vwap and resistance line were forcefully broken by a large green candle and accompanied by large green volume.

nke 2 scenarios nke 2 scenarios .. 1] buy after the break above the resistance 1 and 50ma .. 2] sell after the break under the support level and follow the downtrend channel ..

Nike monthly Long but possible another correction Nike in logarithmic monthly chart . In daily chart possible continues correction until dynamic support line

Watch for swing trade - going up or back down to channel bottomThe red oval is from a previous post when I made a swing put trade. Now price is just sitting above channel. This will provide a good move either back to 110+ or below 100.

$NKE - the time has come$NKE is going to bust. It found a bottom, even if its temporary.
Entry around $101 would be nice but I dont know if we will see that.
Anything in the $105 area is also good. Hold for 10% on the swing and cash out.

Ready for tomorrow? NKE prediction for the next few days This is not financial and I barely, if at all, know what I am doing. But, please follow if you like my predictions.
I thought I would chart NKE because Cramer talked about it the other day and it's fun to watch his inverses. He said Nike was a good buy at the end of last week.
I figured with an economy that is in a recession (not technically), inflation out of control, supply issues, and Covid over in China that this would be a good opportunity to predict a severe downtrend.
There really isn't much in the chart that needs to be stated. The trend is really bad. It is on a steep downtrend and I am expecting a much more serious dip before the middle of July.
The only support I see in the long run is at about $95. If it breaks $95 then I could see an even stronger dip to $65. The last time it was at this level was in 2020. It is already making new lows.

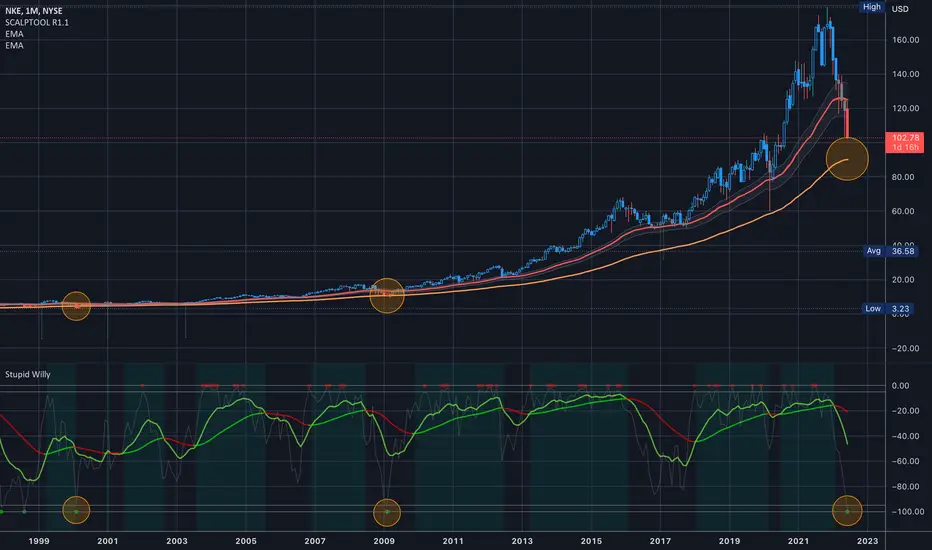
$NKE Analysis, Key levels & Targets$NKE Analysis, Key levels & Targets
Just an observation that since 1989, the 100EMA has been a consistent support for NKE. That would take it to 90.14 today, but that number might be different when it actually crosses…
I have my alerts set…
—-
I am not your financial advisor. Watch my setups first before you jump in… My trade set ups work very well and they are for my personal reference and if you decide to trade them you do so at your own risk. I will gladly answer questions to the best of my knowledge but ultimately the risk is on you. I will update targets as needed.
GL and happy trading.
IF you need anything analyzed Technically just comment with the Ticker and I’ll do it as soon as possible…
$NKE Iron Condor IdeaAfter being struck down -7% post ER and general weak market, I like the idea of selling puts on NKE via an Iron Condor (bull put spread and bear call spread).
With a demand zone 95-100 area, I opened 2x position 100/95p bull spread and 1x position 125/130c bear spreads with another 1x to be added on next green week ( assuming we get one) to capture better call premium .
Opex a few months out will give this trade idea time to work and capture more premium.
If you're more bearish than I on this name, an idea would be to adjust the calls closer to the underlying , say 110/115, however after today's purge I favor the probability on the upside hence the 2x put spread
Iron condors are nice because you can adjust the position as the stock moves (adding more legs, etc. ) with the trade making max profit if Nike is between 100 and 125 in the coming months.
Cheers
