It's early than I thought The market seems more fragile than I thought and the regression is coming earlier than it should be.
SET trade ideas


Y22 SET IndexThailand SET Index is still struggling and under pressure from numerous external factors such as QE, Energy crisis, fear of recession etc. Sideways downward trend is expecting till end of 3Q22. Target bottom is 1475-1480


Which ways SET will go??? I use Stochastic, If Oversold without Lower low 1630 SET will go up but, If Breakdown supports line is 1625 1620
If u wait for collect stock, My idea Set index around 1630 can collect.


SET High-risk Initial LongSET High-risk Initial Long. SL and TPs on the chart. 10-20x leverage. Move SL on TP.

Inverse Head&Sholder SET - ThailandCan be Inverse Head&Sholder or not?? Let see
If can break 1633 and stay will test to break 1643 but in my idea , Index are not strong enough (Indicator doesn't support to break but it can happen too.)

SET INDEX : GLOBAL VIEW (UPDATED) I'm gonna put less of personal thoughts but just
Some facts :
1. SP500 Rebound , SET will be followed but see price action again at resistance
2. It broke down support...confirmed with weekly full candle (Usually going to retest lower one)
3. MACD is about to cross down... See earlier what happened when it crossed down
But it isn't crossed down yet...(can trick n just go up like any tricky crypto coins)
.
That's all i wanna put here..
I will stop stocks because i can only focus one thing which I chose Crypto,,
My forever love crypto :P
Good luck!!

SET weekly: chart patterns May 22 - Jan 23my wild guess, if bearish, it will be :
combinations of 5 factors
1. fib ext. at 1.0 aim
2. bearish trendlines (3 points support)
3. last clear support price
4. MCDX shows that whales are leaving (takes time to come back)
5. time channel (1:1) shows many fine mapped points (1 time zone = 8 months period)
so it could be fun this year.
:P
--note--
for edu purpose only, not financial advice

SET INDEX : Updated If this weekly candle close below 1659
we'r heading 1600 , if not then we still play up zone

Wait to see if there will be any signs of reversal. It's not a gWait to see if there will be any signs of reversal. It's not a good time to get in. If it's off the pipe, we'll probably meet around 1500.

SET NEARLY FINISH WAVE 3Be careful and keep your eyes closely on in "Red box"
It may finish wave 3 then down to make wave 4
but for long-term will be made "new high" on wave 5 ( may take 12-24 months)

Thailand : Recover from Covid-19 and Spike of Inflationas Thai government expected to announce to end of covid-19 pandemic and hope that the tourist around the world will visit Thailand after post-pandemic.
unfortunately, it is probably not going as planned when Russia invaded Ukraine which triggerred sanction from many countries around the world.
the war throw the oil price to the moon, as well as other comodities and the inflation rising up.
the recovery is seam to be as expected.
this chart will show how invest in this circumstance since history may repeat itself.
i will update again after the FOMC meeting, hopefully the interest rate of US would not higher that expected.

SETINDEX Market Cycle Analysis1.According to the chart, Standard Deviation Channel fits very well in giving us a geometry of the market structure.
2.Incorporating EW with timeseries dominant cycle, the uptrend cycles are lasting around 425 weeks before the correction occur which takes 60 and 120 weeks as an harmonic cycle.
3.EMA50/200 Golden Cross and Death Cross does confirm the impulse and corrective wave count. If this primary cycle of EW is correct, we are currently in a 5th wave of the whole cycle since late 1998. The next Death cross would be very crucial for this hypothesis as it might be a leading indication that the last impulse has ended before the invalidation level is broken.
This chart analysis is merely focused on giving you a sense of a macro-picture of SET INDEX...
Well a bit for a short term tips from this chart is that the 50 EMA seems to be important here as it keeps rejecting the seller for months even during this week as well.
Hope you have a great day!

How low grandfather can go? SET index been dropping -40, -50..-- 2 days in a row (half of covid panic)
How low the grandfather "SET" can go?
Everything is on the chart...
i wrote a lot about it in the past... so not gonna type anything much
Trade safe n fun
No financial advice

SET INDEX ( 5 WAVE END? )The Thai stock market may go down if wave 5 ends. SET INDEX ( 5 WAVE END? )


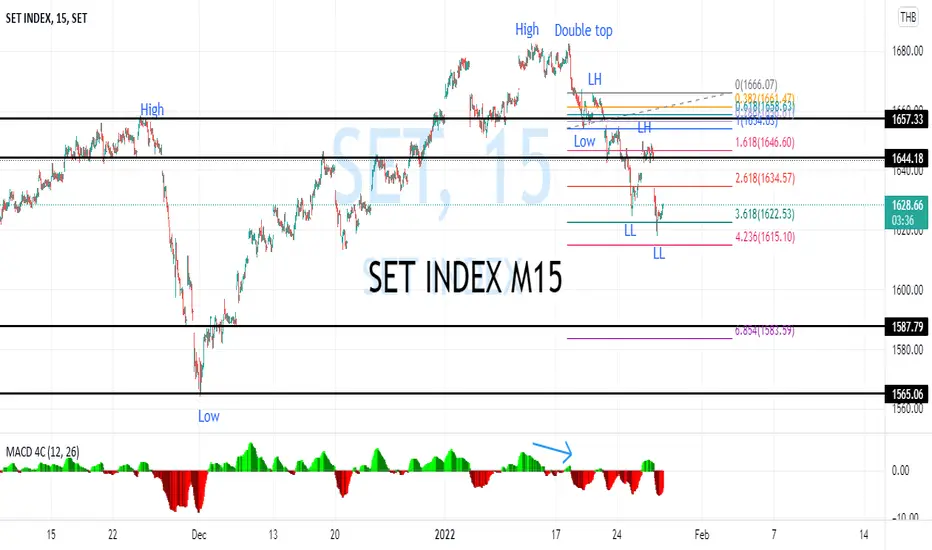
SET Index on the M15 time-frameSET Index on the M15 time-frame
Once the price created double top pattern with a divergence and then reversal pattern.
The price still running downtrend by creating lower high and lower low.
Bearish Divergence Found on SET01/14/22
Close price 13/01/22 at 16
SET expose to Bearish Divergence On
Time Frame Daily
Fib level 0.236 (-1.66%)
1,655
fundamental: nothing significant
