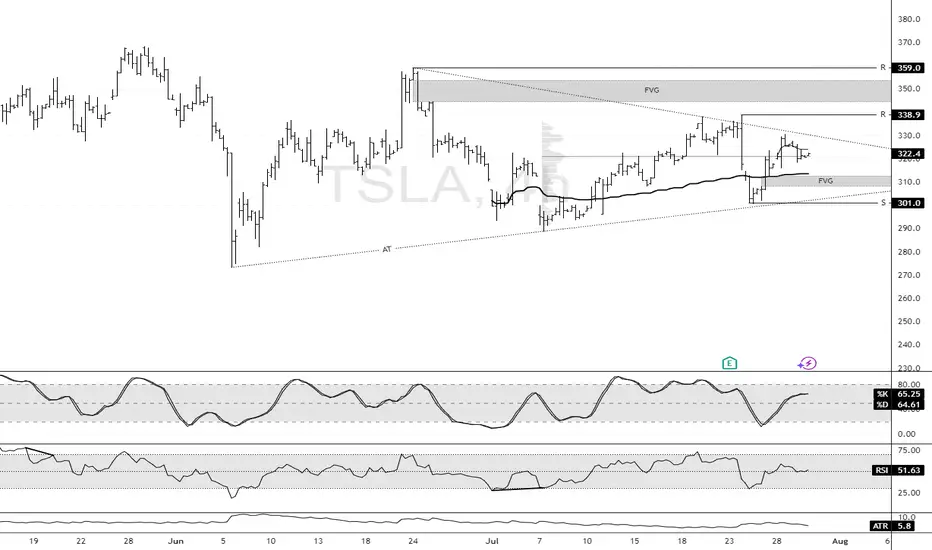
Tesla Builds Toward Fair Value GapFenzoFx—Tesla (#TSLA) bounced from the ascending trendline and closed yesterday's session at the volume point of interest, the $322.3 mark. This level is above the monthly VWAP, meaning bulls are gaining, and bears are losing money.
That said, we expect the uptick in momentum to resume, targeting $338.9, and if this level is breached, the stock will likely aim to fill the Fair Value Gap at $350.0.
TSLA80 trade ideas
TSLA: Here is what I see in TSLA"Zoom In. Follow the Sequence."
Just analyzing sequential wave patterns across multiple timeframes.
You can zoom in and see how structure evolves — impulse, correction, then continuation.
Maybe there’s a strategy here that repeats. Maybe not.
But if there is... it’s worth finding.

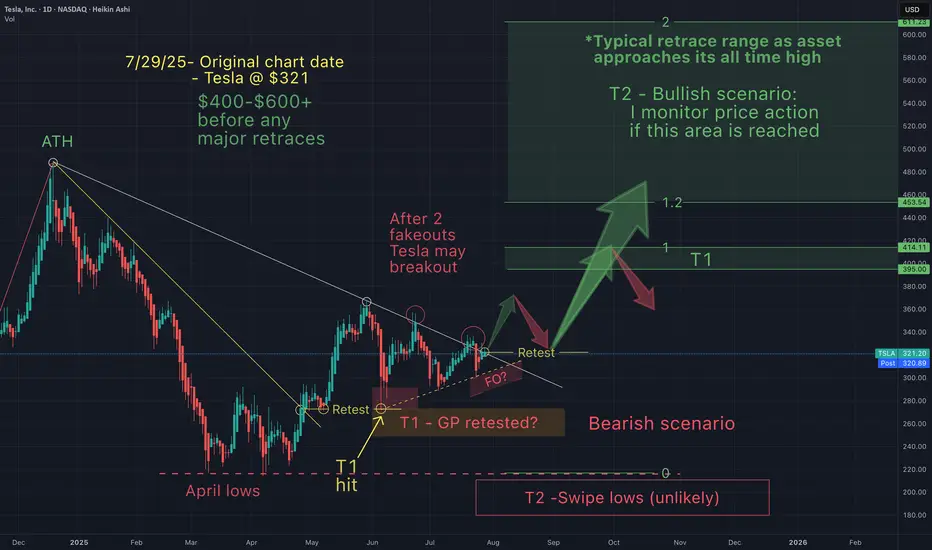
Tesla - A story of an underdogSeveral of the Mag 7 are getting over heated, so I like to look at the ones that haven't caught up.
Since I don't have a crystal ball, I must consider the bearish and bullish scenarios.
As an investor I must pivot accordingly as one of these scenarios gets invalidated.
So on my charts you'll always see both scenarios. Today I'm leaning towards the bull.
Tesla just needs a narrative shift (ie -new invention etc), & price action changes in a heart beat.
Yet, price action really has less to do with the news making Elon a hero, then a villain and then back and forth...but moreso to do with price action patterns that just keep repeating.
So if we don't get a dead cat bounce, I believe Tesla could eventually head towards it's ATH, if this bull market continues.
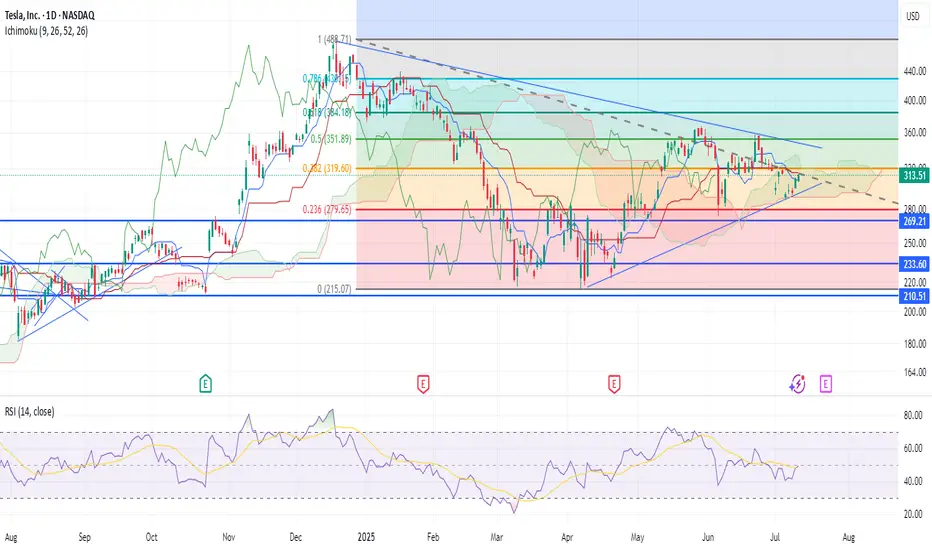
Tesla (TSLA) | Short-Term Compression, Long-Term ExTesla’s daily chart is coiled, with price currently trading at $316, sitting along the 200-day moving average. This looks like a consolidation phase with significant moves building up.
Price Action Snapshot
TSLA sold off last week, rejecting the $335 resistance level before finding footing around $300. The previous range of $280 and $365 is now tightening.
Immediate resistance sits at $335 with a clean breakout above that zone likely triggering momentum back toward the upper range of $365.
The recent drop does not seem like a capitulation move; it's likely institutional redistribution. Smart money is repositioning, not exiting.
Market Is Focused on the Wrong Data
Tesla’s Q2 earnings were objectively weak. Revenue fell 12%, deliveries dropped, and operating margins got clipped.
But this correction isn't all about fundamentals. It is about the market adjusting to a company evolving beyond traditional valuation models.
While most investors are trying to value Tesla like a car company, it’s spending this entire phase retooling itself into an AI and autonomy-first enterprise. That transition doesn't show up in EPS yet (but it will).
The Bigger Picture is Being Missed
The robotaxi rollout in Austin is live. Expansion into California, Phoenix, and Florida is on the roadmap.
Tesla is building a vertically integrated, owner-driven ride-hailing model that could eventually bypass both Uber and legacy OEMs entirely.
Optimus is no longer a lab prototype—it’s moving toward scalable production by 2026.
If Tesla even partially succeeds in general-purpose robotics, it will unlock a Technology Acceptance Model (TAM) that dwarfs the current EV narrative .
Daily Technical Outlook
We’re currently in a bullish compression, with higher lows forming against the resistance area of $365. If $280 holds and the price continues to grind within this wedge, it sets up a volatility breakout scenario.
The breakout level to watch is $335. A daily close above that reopens $365. And beyond that, the resistance level is at $426.
My View
Tesla is compressing, both in price and narrative.
The long game is quietly coming into focus, where the risk/reward skews asymmetrically in favor of the upside.
This daily compression won’t last forever, and when it resolves, the move will likely be outsized.
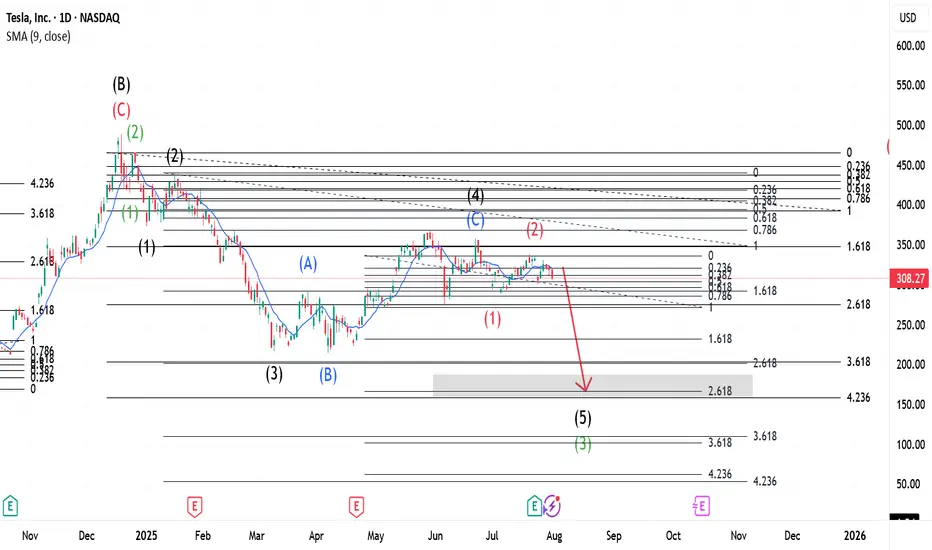
$TSLA ~ Elliott Wave Updates.This whole wave is Wave C(Black) that started when Wave B(Black) was completed. This Wave C(Black) expresses itself in 5 main waves shown in Green. Wave 2(Green) was a Zigzag and a Flat should be expected for 4(Green). Meanwhile, Wave 3(Green) expresses itself in a 5 wave move shown in Black- with Wave 2(Black) being a Zigzag, our 4 was a Flat. This Flat is shown as Blue ABC. When Wave 4(Black) completed, our Wave 5 began which upon completion, would be Wave 3(Green) of the main wave. Wave 2(Red) is a Flat and a Zigzag should be expected after 3(Red).
Go to for more information of the same.
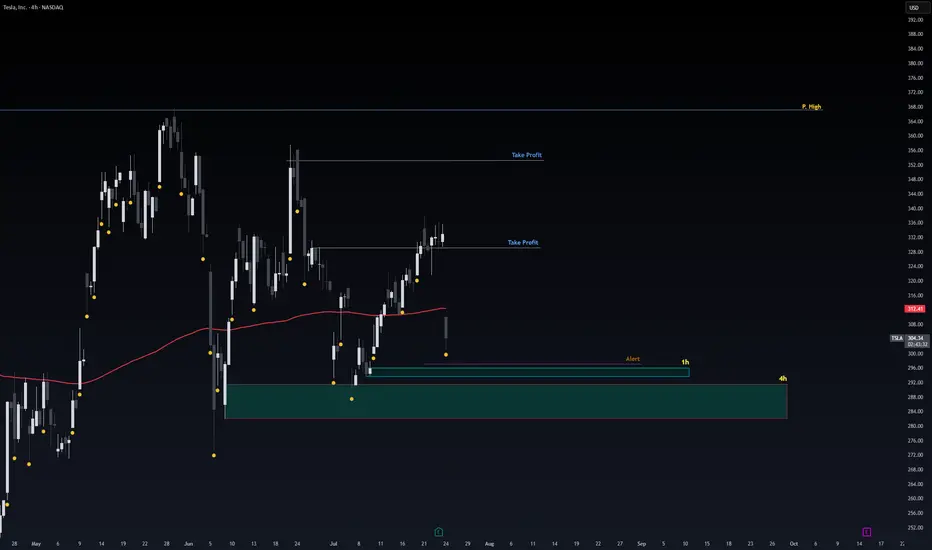
Safe Entry Tesla1h & 4h Green Zones are safest entry Zones.
Stop loss Below.
Note: 1- Potentional of Strong Buying Zone:
We have two scenarios must happen at The Mentioned Zone:
Scenarios One: strong buying volume with reversal Candle.
Scenarios Two: Fake Break-Out of The Buying Zone.
Both indicate buyers stepping in strongly. NEVER Join in unless one showed up.
2- How to Buy Stock (safe way):
On 1H TF when Marubozu/Doji Candle show up which indicate strong buyers stepping-in.
Buy on 0.5 Fibo Level of the Marubozu/Doji Candle, because price will always and always re-test the
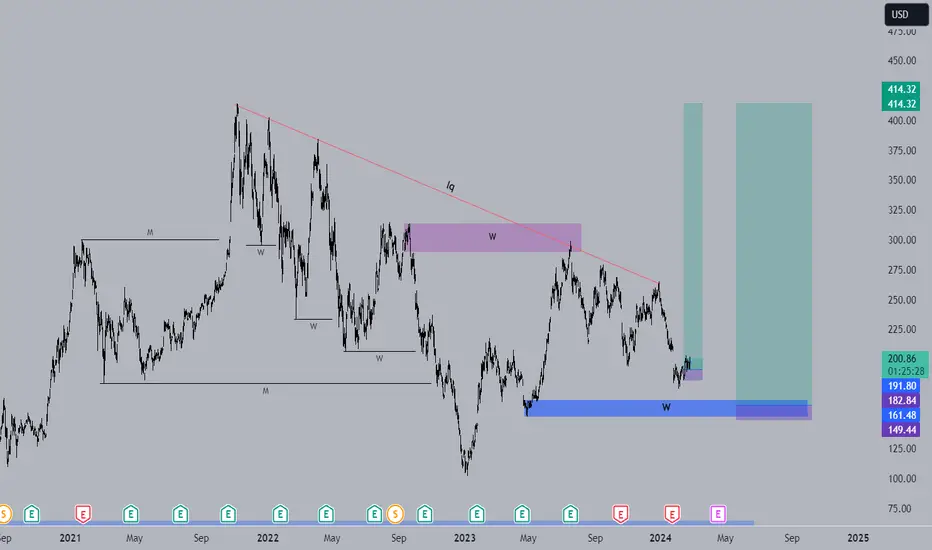
WXY structure with a double topTesla has been in a uptrend with a corrective structure WXY. I am not sure if the WXY is a part of wave 5 terminal structure or a B wave. However expecting a double top or 78.6 retrace to 425-430 range as a minimum. For this scenario, an impulsive upside move is expected within the next few weeks. However the price needs to move back into the channel next week as a first step.

SLA Moderate Bullish Setup – Weekly Play for 08/01 Expiry
## ⚡ TSLA Moderate Bullish Setup – Weekly Play for 08/01 Expiry
🎯 *"Volume confirms it. RSI supports it. Time to strike—or stand by."*
---
### 🔍 Market Intelligence Snapshot:
📊 **Consensus**: Moderately Bullish
📈 **Weekly RSI**: Rising
📉 **Daily RSI**: Still Neutral (momentum building)
📉 **VIX**: Low → Great environment for call buying
📦 **Volume**: Strong institutional activity across models
---
### ✅ Recommended Trade Setup:
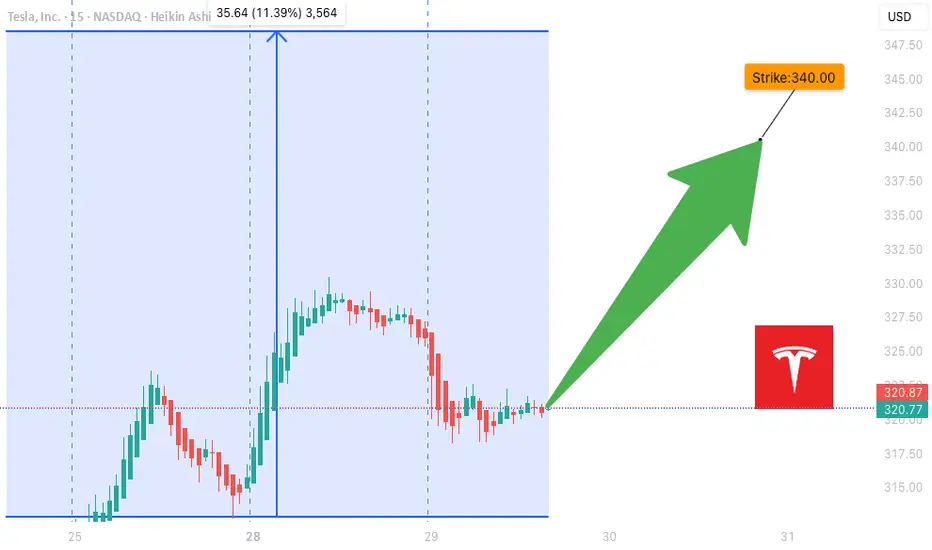
**TSLA \$340 CALL (Exp: Aug 1)**
💰 *Entry*: \~\$0.88
📈 *Target*: \$1.38
🛑 *Stop*: \$0.35
📆 *DTE*: 3 Days
🎯 *Entry*: Market Open
⚖️ *Confidence*: 65%
---
### 🔧 Model Blended Strategy Notes:
* Meta & Anthropic: Suggest ATM/ITM (\$327.50–\$330) → safer, higher cost
* Google & xAI: Prefer \$340–\$342.50 for a better risk/reward
* DeepSeek: Targets \$320 but with heavier premium
🧠 *Takeaway*: \$340 offers a balanced shot — affordable, but still responsive to upside flow.
---
### ⚠️ Risk Notes:
* ⏳ Time Decay → Quick exits = better outcomes
* 📰 External news or earnings reactions = watch for sudden volatility
* 🎯 Position size = keep light due to only 3 DTE
---
### 📊 TRADE SNAPSHOT (JSON):
```json
{
"instrument": "TSLA",
"direction": "call",
"strike": 340.0,
"expiry": "2025-08-01",
"confidence": 0.65,
"profit_target": 1.38,
"stop_loss": 0.35,
"size": 1,
"entry_price": 0.88,
"entry_timing": "open",
"signal_publish_time": "2025-07-29 10:16:14 UTC-04:00"
}
```
---
### 🧠 Quick Captions for Social:
* “TSLA bulls waking up? \$340C looks lit for the week 📈🔥”
* “Call volume surging. RSI rising. Low VIX. This \ NASDAQ:TSLA 340C might run 💥”
* “Risk-managed breakout shot — in and out fast 🎯”
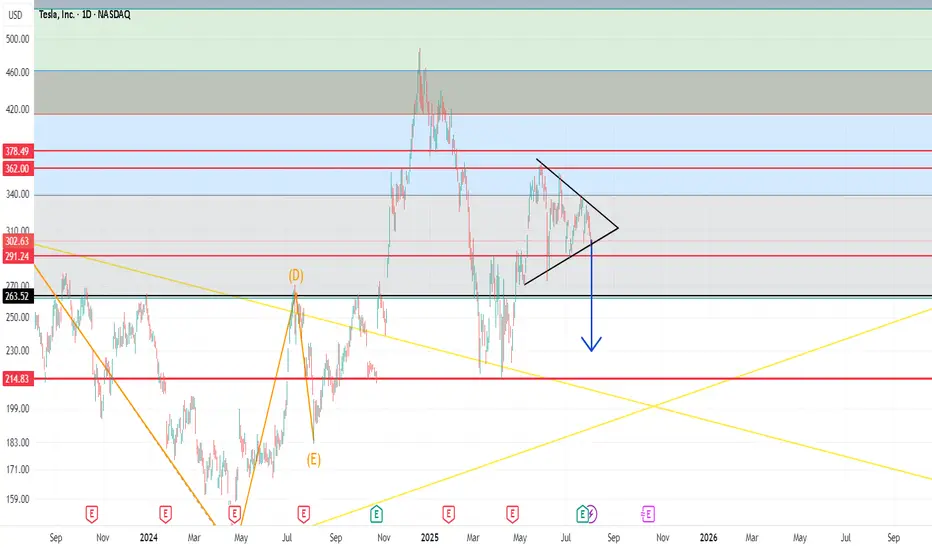
TeslaIn regard to Tesla, not a lot happened last week. Price started to raise back up towards the orange target box the week prior but failed to make new local highs. After that slight raise, it spent the last week grinding lower and breached the prior local low. If it can manage to breach the orange c wave low @ $288.77 (marked by red dashed line), we're headed to the grey target box.
That red dashed line is very significant. The reason being is it invalidates the potential triangle if it gets breached. Should that happen, the only pattern I see is pointing to the grey box. If we do head to the lower target box, the $220's looks like the sweet spot for minor A to complete. I say this due to the green 1.618, yellow 1.618, & white 0.618 fibs being in that area. As you know, all levels of .618 are some of the strongest fibs if not THE strongest.
Should orange prevail, and we have in fact carved out a triangle, the likely target would be the 0.786 @ $429.81 IMO. We have to wait to find out though as price is still refusing to lift its skirt and show the goods so to speak.
To repeat and summarize, below $288.77 and we're likely headed to the gray box. Above the orange (D) high @ $338.88 (orange dotted line), and we're most likely headed to the orange target box. If we can manage to get into the grey box, I will begin looking for an entry very likely in the $220's or $230's.

Unpack the Range, How to buy TeslaHello, I’m The Cafe Trader.
As part of our MAG 7 series, I’m going to show you how to find good pricing on TSLA for your long-term portfolio.
There’s a lot of hype surrounding Tesla right now — and for good reason. From a long-term investment standpoint, the future looks promising. But we still want to enter at the right price.
In my previous article, I gave TSLA a strong buy at $210–$220, and there were multiple opportunities in that range. But that was a few months ago. Let’s take a look at what the charts are telling us today.
⸻
🔲 In the Middle of a Big Range
With a range from $212 to $488, Tesla offers plenty of opportunity for traders — but for investors, it can stir up anxiety.
If you’re holding shares around $330+ and considering selling just to break even, here are three reasons you may want to reconsider:
⸻
1. 🚀 Future Prospects
Tesla is packed with upcoming catalysts:
• Grok AI release
• The highly anticipated Model Q
• Megapack energy storage scaling on an industrial level
These innovations, along with strong brand momentum, could drive the stock 2x, 3x, even 5x over the next few years.
⸻
2. 📈 Trending Up
While some may argue we’re forming a double top, a deeper look at the weekly or monthly chart shows no real signs of weakness. If you’re investing — not just trading — you need that longer-term perspective.
Tesla remains in an uptrend with healthy structure and plenty of strength in the larger timeframes.
⸻
3. 🛡️ Learn to Hedge Your Position
Even if we see 20–30% downside from supply zones, there are ways to protect yourself.
Hedging with options — such as buying puts — can reduce downside risk without selling your shares. If done correctly, you can turn a large drawdown into a smaller loss or even a profit on the hedge.
⚠️ Only do this if you understand how options pricing and time decay work.
⸻
🧠 Passive vs. Aggressive Sellers
Today (July 21st), TSLA tapped into a supply zone and rejected quickly — a sign that sellers are still active around $330, while buyers lack confidence to push through.
🔹 Passive Selling
These are quiet, standing orders — often from large sellers who don’t want to move the market. They sell gradually to avoid spooking buyers.
🔹 Aggressive Selling
This is intentional unloading — where sellers push to exit their position quickly, even at the cost of driving the stock down.
What we saw today looked like passive selling — I’ll cover this in more detail in my short-term TSLA article.
⸻
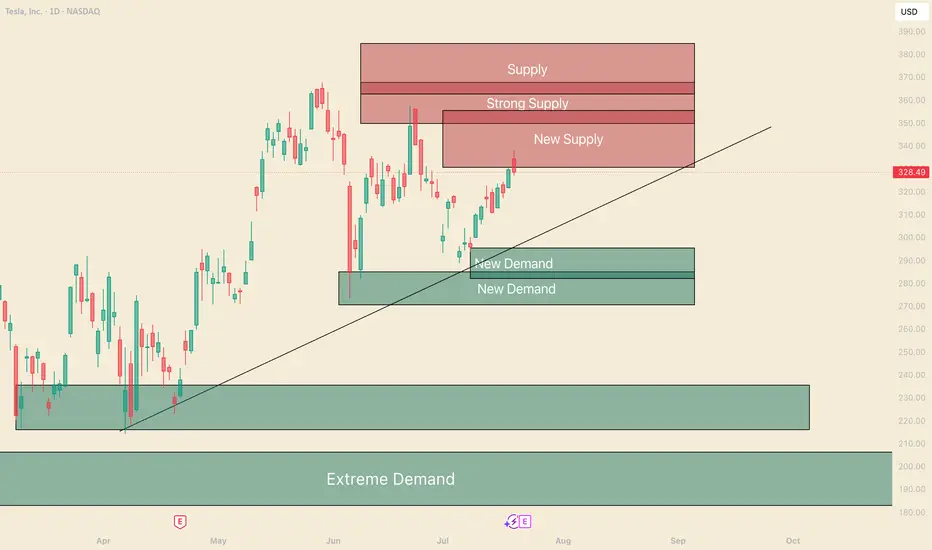
📊 My Buy Zones for TSLA
Fair Price: $296–$310
• $296 is the top of recent buying liquidity
• $310 is the bottom of the current uptrend
• This is where aggressive buyers may show up if sellers ease off
Good Price: $270–$284
• $284 is a strong support level where reinforced buyers have stepped in
• This has been a hot zone and a likely area for long entries to return
Steal Price: $220–$235
• Not marked on the chart, but this zone is high-demand territory
• Even with bad press or short-term issues, this would be a great long-term value buy
⸻
That's All for TSLA Long Term. Follow and stay tuned for a short term analysis.
@thecafetrader
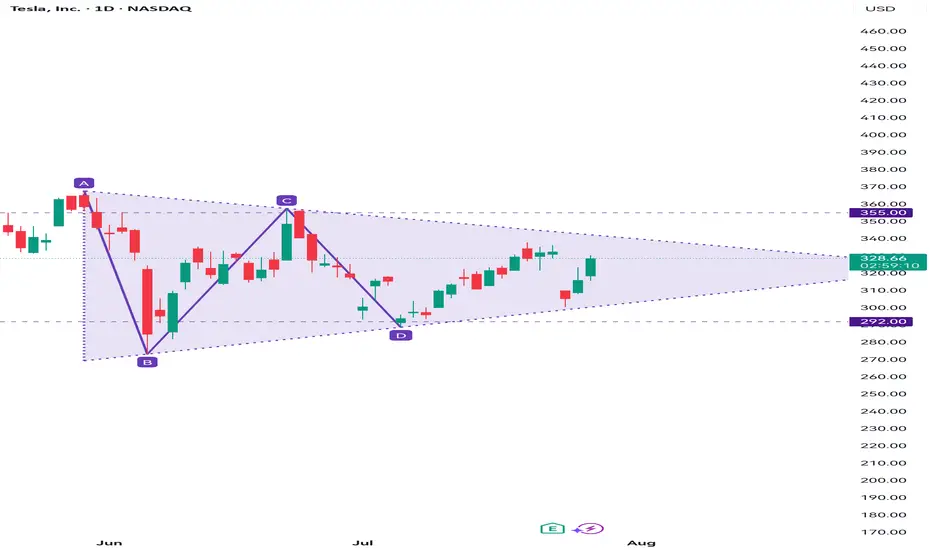
Bearish Triangle: TSLAWaiting for TSLA to breakout 292 to form a bearish triangle pattern.
Target price: 22X
Tesla High Risk of $255Tesla is Stuck under $430 ATH resistance and at high risk of falling back to $255 support.
Tesla is no longer growing and Musk is polarizing and alienating their mostly progressive leaning customer base. This stock simply makes zero sense for a 200 pe ratio.

TESLA: Bullish Continuation & Long Trade
TESLA
- Classic bullish setup
- Our team expects bullish continuation
SUGGESTED TRADE:
Swing Trade
Long TESLA
Entry Point - 302.63
Stop Loss - 296.98
Take Profit - 312.87
Our Risk - 1%
Start protection of your profits from lower levels
Disclosure: I am part of Trade Nation's Influencer program and receive a monthly fee for using their TradingView charts in my analysis.
❤️ Please, support our work with like & comment! ❤️

TSLA: 308.27Bullish Entries: 312.00/318.00 Stop 316.00 / Target 322.00–325.00
Bearish Entries: 304.00/300.00 Stop 302.00 / Target 296.00–292.00. Note: If the open starts above 312.00, we should wait for it to touch 318.00. Then, 320.00 is the entry for the previous day's bearish trend reversal and the new uptrend.

TSLA Weekly Bearish Play — August 2, 2025
🔻 **TSLA Weekly Bearish Play — August 2, 2025** 🔻
🚨 **Multi-Model Consensus Signals a Tactical Put Opportunity**
### 🔍 Market Snapshot:
* **Daily RSI:** 39.9 (Bearish)
* **Weekly RSI:** 53.2 → Falling
* **Volume:** Weak (0.8x last week)
* **Options Flow:** Neutral (C/P Ratio \~1.04)
* **VIX:** 20.38 → Favorable for Options Plays
* **Institutional Support:** Weak
---
### 🔮 Model Consensus:
📉 **All major models (xAI, Google, Claude, Meta, DeepSeek)** confirm:
* Bearish momentum on both daily + weekly RSI
* Weak volume = cautious institutional behavior
* Volatility setup perfect for short-dated puts
---
### 🎯 Viral Trade Setup:
**💥 Trade Type:** PUT (Short TSLA)
**🔻 Strike:** \$300
**📆 Expiry:** 2025-08-08
**💰 Entry Price:** \$6.65
**🎯 Target Exit:** \$10.64 – \$13.30 (60%-100% gain)
**🛑 Stop Loss:** \$3.99
**📊 Confidence:** 65%
**📍 Entry Timing:** Monday open
**🕒 Signal Timestamp:** 2025-08-03 01:33:56 EDT
---
### ⚠️ Key Levels:
* Support to watch: **\$297.82**
* News/event risks: Stay alert ⚡
* Use tight risk controls for weekly plays!
---
🔥 **If you trade TSLA — don’t sleep on this one.**
Bearish consensus + clean setup = **high-probability weekly play.**

TSL PatienceTSL Fractal. Another several months of accumulation until December 2027 Chop then Parabolic. Chop Chop Chop. Dollar Raising Risk Off. Bitcoin Topping. Dollar Bottoming.

A Strategic Long Opportunity Amid VolatilityCurrent Price: $316.06
Direction: LONG
Targets:
- T1 = $324.00
- T2 = $328.50
Stop Levels:
- S1 = $312.50
- S2 = $308.00
**Wisdom of Professional Traders:**
This analysis synthesizes insights from thousands of professional traders and market experts, leveraging collective intelligence to identify high-probability trade setups. The wisdom of crowds principle suggests that aggregated market perspectives from experienced professionals often outperform individual forecasts, reducing cognitive biases and highlighting consensus opportunities in Tesla.
**Key Insights:**
Tesla’s stock presents both short-term risks and long-term upside opportunities. Despite recent earnings misses and margin compression, its pivot into AI and robotics offers significant growth opportunities. Upside resistance zones near $325-$330 create favorable price targets, while support levels at $307-$310 suggest strong buying interest. This environment could favor a long trading strategy, provided disciplined risk management is maintained.
**Recent Performance:**
Tesla recently experienced notable sell-offs following disappointing earnings, attributed to compressed margins and weaker EV demand. However, the stock rebounded 3.5% from last week’s lows, signaling resilience amid uncertainty. Year-to-date, Tesla remains one of the top-performing stocks with a 54% price increase, reflecting strong underlying investor confidence in its long-term story.
**Expert Analysis:**
Market experts are divided on Tesla’s trajectory. Near-term fundamentals appear challenging with declining revenue (-12% YoY) and price cuts impacting profitability. However, bullish projections from analysts such as Kathy Wood highlight Tesla’s potential for disruptive innovation in AI and robotics. Its ambitious initiatives like robo-taxi deployment add speculative appeal but also introduce scaling and regulatory risks.
**News Impact:**
Tesla’s upcoming robo-taxi launch in San Francisco is poised to impact market sentiment significantly. While safety drivers will be required during the initial rollout, scalability and regulatory challenges could limit the project’s immediate impact. Meanwhile, recent disappointing earnings results may weigh on sentiment in the short term while providing an opportunity for potential retrishments off support levels.
**Trading Recommendation:**
Given the current setup, Tesla appears poised for long-term growth, with upside resistance levels suggesting a viable rally opportunity. Investors should consider taking a bullish position while maintaining stops near key support zones to mitigate downside risks. This balanced approach aligns well with Tesla’s speculative appeal and broader investor sentiment.

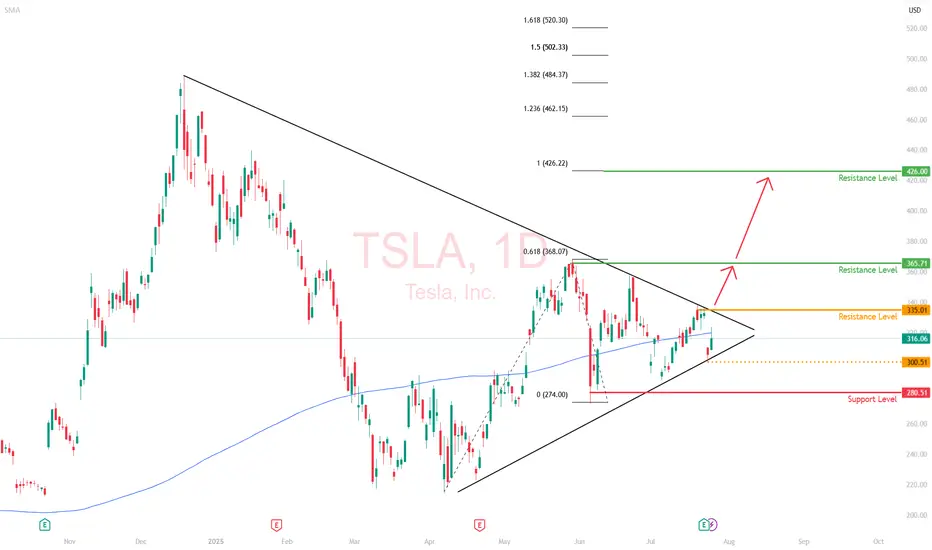
TSLA BUY+++ WEDGE FORMING $339 first targetTSLA, like AAPL, is forming a bullish wedge which likely will break to the upside. First target is $339 at wedge resistance then will reevaluate
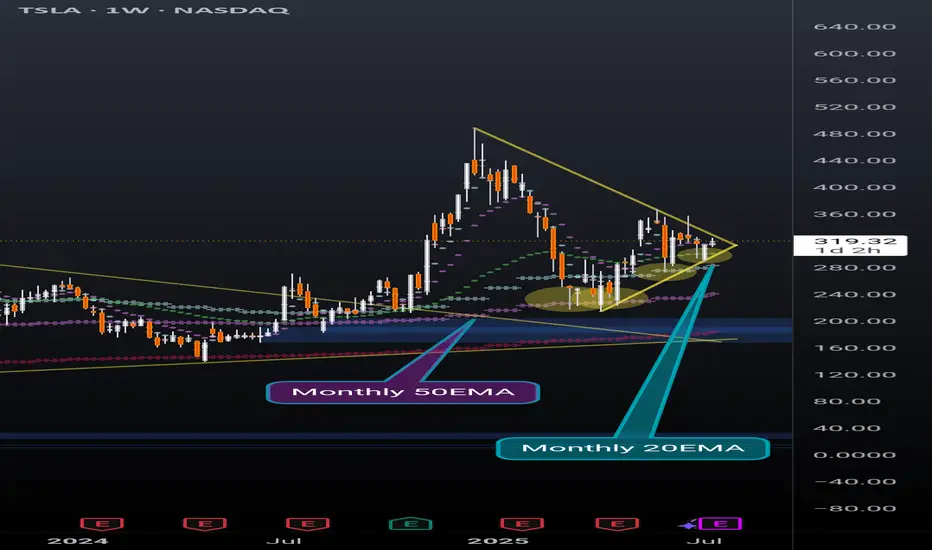
TSLA weekly coiling into something powerfulNever doubt the power of TSLA. Recently broke out of a huge pennant, and now nearing the end of another pennant while simultaneously holding support above the daily 20EMA(overlayed on this weekly chart).
Also recently found support off of the monthly 20EMA (overlayed on this weekly chart) and took 2 direct hits on the monthly 50EMA (overlayed on this weekly chart) before that and rallied up. It will take a lot to crush this setup but anything can happen. Possibly a longer pennant formation.
I'm just a cat not a financial advisor.
Two Trades to go Bullish on TSLAHello, I’m The Cafe Trader.
We’ve been tracking the MAG 7, and Tesla is the next focus for our short-term options or swing trade strategy.
I’m looking at two scenarios that are likely to play out with TSLA over the next few weeks.
For fundamental and long-term analysis, check my other article on TradingView.
⸻
Even though we’re sitting near the middle, bulls have just pushed into a bearish liquidity level (marked “Bottom of Supply”). We don’t know how much supply is left here, but the fact that bulls are pressing in suggests the bears are losing steam. This doesn’t mean price won’t pull back—it just means bearish follow-through may be weaker.
With that in mind, here are the two main scenarios:
⸻
1. Green Arrow — Bullish Test of Sellers
– Stock
If bulls keep the pressure on, we may see a test of the “Big Sellers” zone. The reaction there will tell us a lot.
If we see a sharp rejection (a quick tag followed by a flush) or a fake breakout that reverses, I’d approach longs more cautiously.
However, an aggressive entry long around the “Top of Demand” (around $321) could make sense, especially considering how buyers have been stepping in. This setup is primed to retest highs.
– Options
Pricing will be key here—especially post-earnings (EOD).
I’d look 2 weeks out. If you can snag a 335C for $5.00–$7.00, that’s solid.
Target profit would be into the Big Sellers zone. If we get a strong move before then that nets 3R–5R, I’d take it.
⸻
2. Red Arrow — Bearish Reaction + Big Buyer Support
– Stock
If earnings disappoint, we could see a shift in momentum. That said, big buyers should step in around $295.
This is actually the more likely scenario in my view.
From there, I’d look for a swing back up into the 330–350 range.
We’ll need to see how sellers handle the drop—are they aggressive, or is it just a lack of buyer interest?
Either way, this could align well with long-term buy zones.
– Options
On a flush to $295, I’d look for 3–5 day expiration calls around the 305 strike. @ a price between $1.50–$1.70 (look for 2-3R)
After the bounce, I’d expect a pause or retest of the uptrend line.
Then I’d look 2–3 weeks out for the 325C or 330C, ideally between $3.00–$5.00.
I’ll keep an eye on option pricing and update if we reach that level.
⸻
That’s all for short-term TSLA.
Follow for more charting and trade ideas.
📲 @thecafetrader

TESLA PRICE ACTION 22 JULY 2025This is the price action for Tesla. i have discussed indicators as well. Do not blindly trade without understanding the logics. I am long here with stocks & calls.
NOTE: DO NOT BLINDLY BUY
