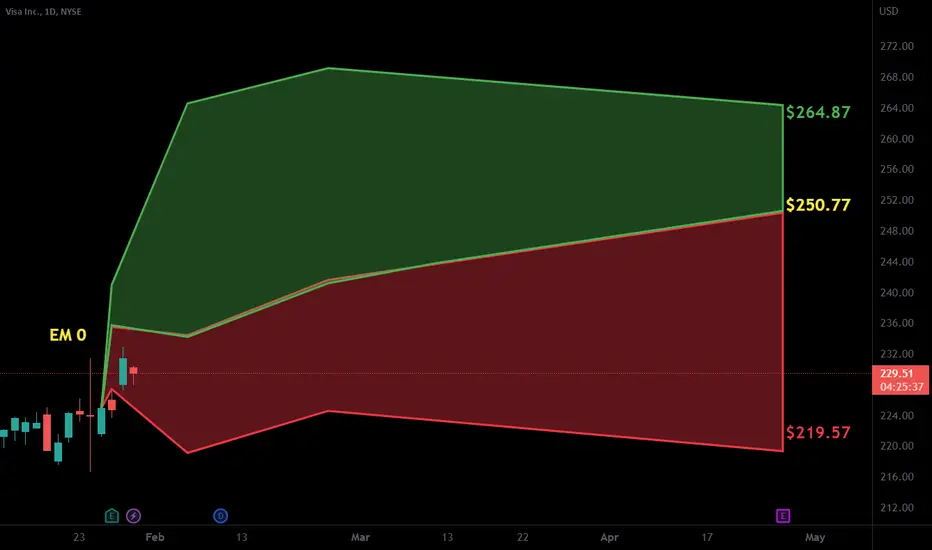
V Visa Options Ahead of EarningsIf you haven`t sold V Visa here, for a better reentry:
Then analyzing the options chain of V Visa prior to the earnings report this week,
I would consider buying the 230usd strike price Puts with
an expiration date of 2023-6-16
for a premium of approximately $5.65.
If these options prove to be profitable prior to the earnings release, I would sell at least half of them.
I am interested to hear your thoughts on this strategy.
VISA80 trade ideas

Visa: Vis – à – vis 👀Visa is moving just under the resistance at $235.85 – vis-à -vis with this mark, so to speak. Soon, the share should climb above this level, though, to complete wave b in magenta. This done, it should return below $235.85 and continue the descent below the support at $208.76, dropping into the turquoise zone between $204.28 and $187.10. There, the stock should finish wave 2 in turquoise, whose low should then initiate fresh upwards movement. However, there is a 34% chance that this low could already be established in the form of wave alt.2 in turquoise. In that case, Visa would maintain the upwards momentum.

Visa, will it just consolidate till earnings?It seems it will be stuck there till earnings, we will see. I’m keeping an eye.

V - Rising Trend Channel [MID TERM]- V is in a rising trend channel in the medium long term.
- The stock has broken up through resistance at 231.
- The short term momentum of the stock is strongly positive, with RSI above 70.
- However, particularly for big stocks, high RSI may be a sign that the stock is overbought and that there is a chance of a reaction downwards.
- The stock is overall assessed as technically positive for the medium long term.
*EP: Enter Price, SL: Support, TP: Take Profit, CL: Cut Loss, TF: Time Frame, RST: Resistance, RTS: Resistance to be Support LT TP: Long Term Target Price
Verify it first and believe later.
WavePoint ❤️

Visa Inc!!!Hello ladies and gentlemen, according to my graphical analysis of NYSE:V , there is a high probability of a incline towards the 231,50 usd level in the next few months!
if you have any questions do not hesitate to contact me.

VISA - BULLIS CONTINUATIONThe middle Visa price target is $256.47, with the highest Visa stock price forecast at $288.00 and the lowest Visa stock price forecast at $210.00 for the range of 2023. Visa is one of the leaders in card issuing and the digitalizing of payments makes card transactions a daily routine, carrying cash is very old-fashioned. That's why we think Visa is something likely to grow for at least a year or two before taking over by crypto for example. Who knows of Ripple's win against SEC to see Ripple's dominance in transacting and companies like Visa and Mastercard go down the drain?
Risk Disclosure: Trading Foreign Exchange (Forex) and Contracts of Difference (CFD's) carries a high level of risk. By registering and signing up, any client affirms their understanding of their own personal accountability for all transactions performed within their account and recognizes the risks associated with trading on such markets and on such sites. Furthermore, one understands that the company carries zero influence over transactions, markets, and trading signals, therefore, cannot be held liable nor guarantee any profits or losses.

NYSE - VISA - BREAK & RETEST - MOMENTUMBeginning testing phase using my system in the stock market!
Aiming for being able to use it for my own personal longer term investments, ideally to diversify and sow multiple income streams!
The strategy is simple but very systematic and well defined and it's taken me many years to really put together every part of successful trading down to the most intricate detail. If it can work in other markets as well as forex, then the proof will be in these public ideas that everyone has access to and that can't be deleted once posted so there will be no doubt of the authenticity and quality of the system. Which in turn, might open the door later on for potential educational material to diversify income streams which will in turn bring a higher quality of execution in the markets because there will be less financial pressure to perform.
Anyways before any of that takes place, I must see if the system can achieve a positive expectancy in stocks so be on the lookout for future stock posts as well.
Starting out with V using my bread and butter! The classic B&R play that appears throughout my ideas in forex. As far as timeframes, from pure observation in past instances with the stock market, I've found the 3 Day candle chart to be particularly clean in terms of price action so that will become my default timeframe for stocks for this first testing phase.
Lets see how this plays out over the next few weeks!

long position on VMy strategy is based on price action with the reading of certain indicators that I like while respecting all the values that define the stock maket

Visa (V): Recovering From a Recent DipVisa (V) is poised for strong double-digit earnings growth as the global trend of cashless transactions continues.
The stock is valued attractively based on multiple years of growth.
Visa's stock is likely to outperform over the long-term based on valuation, growth, and earnings upgrades.
Visa's daily chart above shows a positive upward trend. The stock recently dipped and looks like it may begin a new uptrend leg higher. This would be confirmed by the MACD indicator in the middle of the chart. The trend would be considered back to positive when the blue line crosses above the red signal line. The purple RSI line at the bottom of the chart is showing positive strength, indicating that the stock may continue upward.

V Visa Options Ahead of EarningsIf you haven`t sold V Visa here, to reenter on the buy area:
Then you should know that looking at the V Visa options chain ahead of earnings , I would buy the $222.50 strike price Puts with
2023-1-27 expiration date for about
$3.64 premium.
If the options turn out to be profitable Before the earnings release, i would sell at least 50%.
Looking forward to read your opinion about it.

Rising WedgeEarnings have past with a beat. Next report in April.
W pattern and if the 4th leg is complete, it turned down at the 1.414. I can not find this pattern anywhere but has been common as of late. I call it W 4.414 and M 1.414. !.414 is the square root of 2.
Price is above the .235 of the trend up.


Neutral V - Watching the levelsThe P&L is for the reference of entry, potential upside and cut loss point. The dates on it have no relevance.

$V with a Bullish outlook following its earnings #Stocks The PEAD projected a Bullish outlook for $V after a Positive Under reaction following its earnings release placing the stock in drift A with an expected accuracy of 42.86%.
Short Signals on Visa at 250$Double top with clear retest of breakdown of multi year channel as seen below. Confluence of these conditions makes Visa a great short candidate back to support zone in purple below.

$V Trade Idea 3-2-2 reversal on daily and hammer on the week$V Trade Idea
3-2-2 reversal on daily and hammer on the week
Calls over $224.31
Target: $229
Puts under $220.41
Target: $217.50
NYSE:V

VNot financial advice. The essence of investing & trading is the intelligent and patient preying on the greed, fear, impatience, addiction and ignorance of the majority. It's definitionally Darwinian.

Bullish Divergence Bullish Divergence on the annual time frame indicating Visa is setting up for a blow off top to make new all time highs. Only time will tell. But as the use of digital payments continue to rise. so will VISA stock price imo.

visa and bollinger band Bollinger band suggest the counter is ready to make a breakout
multiple times respected bollinger band earlier as shown in the chart.
the counter in past have seen support from mid or lower band
while resistance at the upper band along with retracements at mid band when in uptrend.
which sugest the counter is a good candidate to play via BB

Technical Analysis of VISA. Hello all,
This is my price action analysis of VISA. Over the period of time, we can see Support and Resistance levels formed which have been tested a couple of times throughout the year. All this happening in a downtrend with each testing of the Resistance doing e lower high. In late September the price broke through the support level after which it formed a textbook double bottom and did a two-week rally. It tested the resistance line, and did a retracement after which it broke above, and created the first higher high this year. Now the price is at a crucial level testing the previous resistance and now the support line. It's important to watch what the price will do here. It will either bounce back and go for the 220$ zone or cross below the support level and search for a new zone where the bulls will come in.
The next few days will be crucial in terms of price action, as they will establish the new mid-term trend and direction of the price.
And what do you think of VISA (NYSE:V) currently?
I would love to hear your thoughts in the comment section.
Cheers!

$V has heavy resistance aheadNYSE:V failed to break above 218 in June, July and August of this year. It retreated, and is taking another run at it.
I'll probably buy some puts if it reaches 217.50 or so ... with a tight stop loss ... I'll cut my losses if V reaches up to 220.

Selling Visa at swing highs.Visa - 30d expiry - We look to Sell at 216.49 (stop at 223.41)
We are trading at overbought extremes.
Bearish divergence can be seen on the daily chart (the chart makes a higher high while the oscillator makes a lower high), often a signal of exhausted bullish momentum, or at least a correction lower.
Bearish divergence is expected to cap gains.
We look for a temporary move higher.
The previous swing high is located at 217.61. 218.07 has been pivotal.
Preferred trade is to sell into rallies.
Our profit targets will be 199.22 and 195.22
Resistance: 215 / 218 / 225
Support: 206 / 200 / 195
Disclaimer – Saxo Bank Group.
Please be reminded – you alone are responsible for your trading – both gains and losses. There is a very high degree of risk involved in trading. The technical analysis , like any and all indicators, strategies, columns, articles and other features accessible on/though this site (including those from Signal Centre) are for informational purposes only and should not be construed as investment advice by you. Such technical analysis are believed to be obtained from sources believed to be reliable, but not warrant their respective completeness or accuracy, or warrant any results from the use of the information. Your use of the technical analysis , as would also your use of any and all mentioned indicators, strategies, columns, articles and all other features, is entirely at your own risk and it is your sole responsibility to evaluate the accuracy, completeness and usefulness (including suitability) of the information. You should assess the risk of any trade with your financial adviser and make your own independent decision(s) regarding any tradable products which may be the subject matter of the technical analysis or any of the said indicators, strategies, columns, articles and all other features.
Please also be reminded that if despite the above, any of the said technical analysis (or any of the said indicators, strategies, columns, articles and other features accessible on/through this site) is found to be advisory or a recommendation; and not merely informational in nature, the same is in any event provided with the intention of being for general circulation and availability only. As such it is not intended to and does not form part of any offer or recommendation directed at you specifically, or have any regard to the investment objectives, financial situation or needs of yourself or any other specific person. Before committing to a trade or investment therefore, please seek advice from a financial or other professional adviser regarding the suitability of the product for you and (where available) read the relevant product offer/description documents, including the risk disclosures. If you do not wish to seek such financial advice, please still exercise your mind and consider carefully whether the product is suitable for you because you alone remain responsible for your trading – both gains and losses.

VISA SHORT TIMBERRRR!!!VISA formed a rising wedge on the 4hr time frame and broken its support. Secondly on the daily time frame VISA formed a descending channel which it broke out of and reentered due to a false break out. Current play is $200 puts out for Jan-Feb
:)
