Related currencies

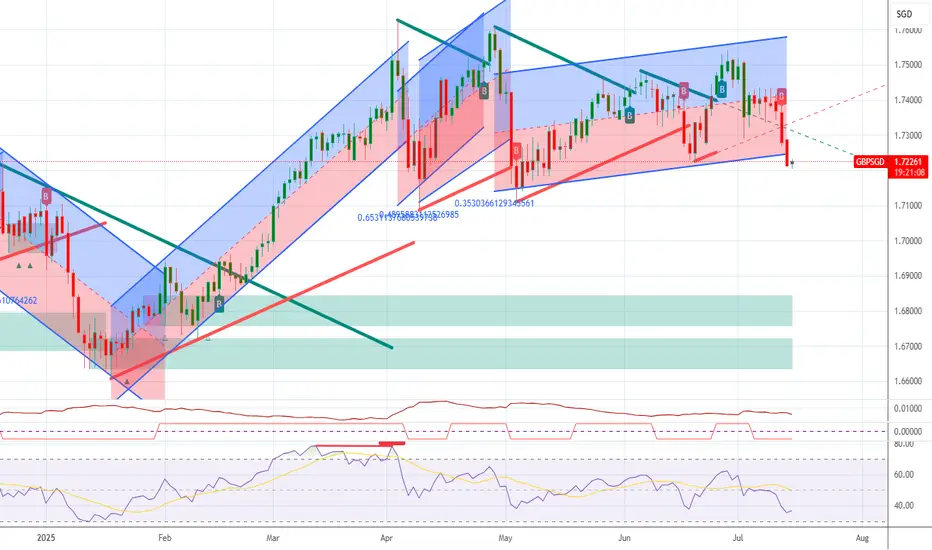
GBPSGD LongGBPSGD is now net long on the regression break.
I am not taking this trade as I feel the market doesn't have much to run upwards.

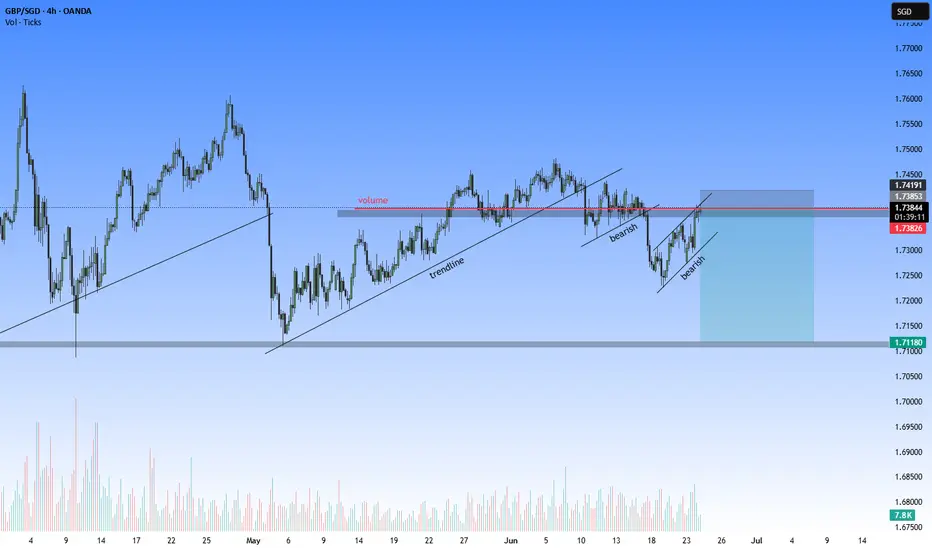
GBPSGD buy !!Price is sitting @ a strong resistance area and beautiful rejection from the downside . it is time to buy this pair with 1:4 risk rewards. do not risk more than 1% per trade.

GBPSGD short ideaTrading involves substantial risk and is not suitable for all investors. Past performance is not indicative of future results. Always conduct your own analysis and consider your risk tolerance before entering any trade.😉😉


GBPSGD ShortGBPSGD is now net short on the regression break.
I am consider the correct EA to use on the enter to maintain a limited risk.

GBPSGD LongGBPSGD is now net long on the regression break.
It has been on a run for sometime and it at all time highs. I am not taking this trade.

GBPSGD ShortGBPSGD is now net-Short on the regression break.
I am considering my EA options with limited risk and profit targets.

See all ideas
Summarizing what the indicators are suggesting.
Oscillators
Neutral
SellBuy
Strong sellStrong buy
Strong sellSellNeutralBuyStrong buy
Oscillators
Neutral
SellBuy
Strong sellStrong buy
Strong sellSellNeutralBuyStrong buy
Summary
Neutral
SellBuy
Strong sellStrong buy
Strong sellSellNeutralBuyStrong buy
Summary
Neutral
SellBuy
Strong sellStrong buy
Strong sellSellNeutralBuyStrong buy
Summary
Neutral
SellBuy
Strong sellStrong buy
Strong sellSellNeutralBuyStrong buy
Moving Averages
Neutral
SellBuy
Strong sellStrong buy
Strong sellSellNeutralBuyStrong buy
Moving Averages
Neutral
SellBuy
Strong sellStrong buy
Strong sellSellNeutralBuyStrong buy
Displays a symbol's price movements over previous years to identify recurring trends.
Frequently Asked Questions
The current rate of SGDGBP is 0.57876 GBP — it has decreased by −0.14% in the past 24 hours. See more of SGDGBP rate dynamics on the detailed chart.
The value of the SGDGBP pair is quoted as 1 SGD per x GBP. For example, if the pair is trading at 1.50, it means it takes 1.5 GBP to buy 1 SGD.
The term volatility describes the risk related to the changes in an asset's value. SGDGBP has the volatility rating of 0.18%. Track all currencies' changes with our live Forex Heatmap and prepare for markets volatility.
The SGDGBP showed a −0.77% fall over the past week, the month change is a 0.70% rise, and over the last year it has decreased by −2.42%. Track live rate changes on the SGDGBP chart.
Learn how you can make money on rate changes in numerous trading ideas created by our community.
Learn how you can make money on rate changes in numerous trading ideas created by our community.
Currencies are usually traded through forex brokers — choose the one that suits your needs and go ahead. You can trade SGDGBP right from TradingView charts — just log in to you broker account. Check out the list of our integrated brokers and find the best one for your needs and strategy.
When deciding to buy or sell currency one should keep in mind many factors including current geopolitical situation, interest rates, and other. But before plunging into a deep research, you can start with SGDGBP technical analysis. The technical rating for the pair is sell today, but don't forget that markets can be very unstable, so don't stop here. According to our 1 week rating the SGDGBP shows the sell signal, and 1 month rating is sell. See more of SGDGBP technicals for a more comprehensive analysis.