SGDUSD trade ideas

26 Aug: USDSGD bounce incomingHi everyone, USDSGD is approaching the support zone in line with the 78.6% retracement and ascending trend line which presents an opportunity to buy. A break above the resistance zone at 1.35980 could see a further upside in prices.

usdsgd longusdsgd long.
into support.
profit target in a moving average will be be adjusted over time.

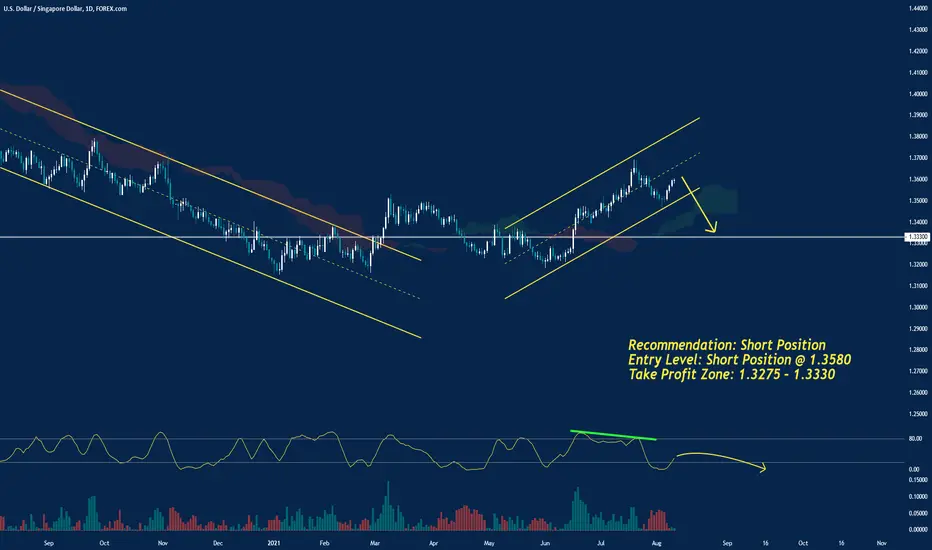
USDSGD Bearish Reversal, Expect Down Move here
Hi everyone:
Here on USDSGD, there's potential opportunities for a bearish continuation to happen.
We can see after a strong bearish impulse phase on the higher time frame, price begin to correct within a larger expanding correctional structure.
With a few swing highs and lows, price had a move up, but failed to continue higher. with any further bullish corrections.
Instead it formed a reversal impulse move down, follow by a bearish continuation.
This all good indication that the expanding structure has hit the top, and a bearish continuation of the higher time frame is possible.
Watch for lower time frame price action to form continuation correction after breaking out to look for entries down the recent lows.
Thank you

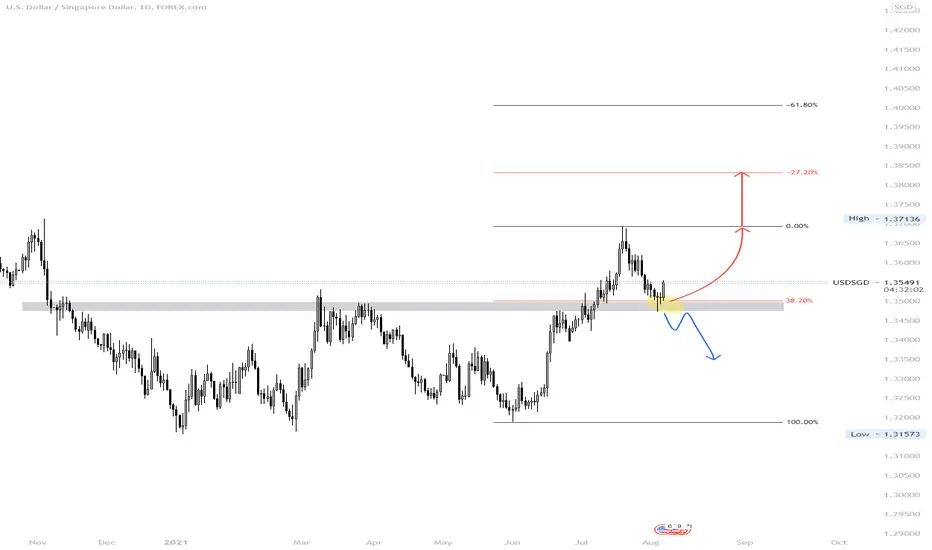
USDSGD selling opportunity USDSGD SELL SETUP
- USDSGD breached below a bullish counter-trendline
- Structure is pushing down
- We have a break in market structure
- Price is approaching Low of the day (we can expect a pullback to our area of interest marked in as rectangle on the chart)
- Trend predilection is (BEARISH)
- Momentum (Bearish)
- Environment (Bearish)
- Plan is to wait for a Short opportunity on USDSGD
- Take the trade when your rules are fulfilled
A BEARISH MOVE is probable in this market.

Ascending within Ascending + Breakout bear Flag entryWe have An ascending Structure within a larger Ascending structure, Price looks like it may be forming a HTF "M" style pattern but the sell off may come sooner, that's why the focus is on the the ascending within and when it completes. Looking for tight LTF correction after the breakout for the entry.

USDSGD-Will reach 1.34 for b) or triangle or irregular ?Market Commentary:
LEARNING ELLIOTT WAVES IS LITTLE BIT TOUGH (FOR ME IN BEGINNING) BUT I TOOK IT AS A CHALLENGE AND THAT IS NOT IMPOSSIBLE ALSO...
First have an look for the positional trend i shared here previous....if you are a follower of me...and sometimes i will share the counter trend trade also in 15 mins and 1hr...but that is risky ones...so if the trend is bearish or bullish, if i am expecting the correction...book the profit there and wait the correction to end and again go with the trend....DONT TRADE THE COUNTER TRADE SETUP...you will took loss too...try to identify the short term pull back and the long term pull back after that took small lots in the short term PB with strict stop and go with big lots in the trend side that is long term. I WONT TOOK ALL THE TRADE PLAN SHARED HERE...
Read the market commentary inside the chart what i shared here carefully and try to learn Elliott waves...otherwise its tough to understand the market commentary and my analysis. I wont give a entry, stop loss and take profit in my chart...it is only for EDUCATIONAL PURPOSE and i am sharing how i am analysing the pair and labelling them according to the Elliott wave theory...I AM JUST SHOWING THE TREND HOW IT MAY GO AND MY VIEW(it may wrong too)..so DON'T FOLLOW BLINDLY MY CHART. Take this as a reference and if it correlate to you strategy took the trade as per your strategy...DON'T ASK ABOUT YOUR RUNNING TRADES i wont comment on them and I WONT SUGGEST TO TAKE MY TRADE SETUP.
I am a technical analyst based on trendline, channel, fib retracements, expansion, stochastic for divergence, EMA's and MA's are finding the pull backs and MAJOR IS ELLIOTT WAVES...those mentioned above are using as a TOOLS only. I am not a fundamental, sentimental trader...but only the fundamental will boost my technical analysis to reach my target or sometimes it will go against me and then i will manage the trade according to the Elliott waves alternate views...Each and every trade plan i am sharing here has a alternate view and i am sharing only the most probabilities(70-80%) here...sometimes the other (20-30%) may market do..then i will change the wave counts and labelling according to the price action.
All labelling and wave counts done by me by manually and i will keep change according to the LIVE MARKET PRICE ACTION. So dont bias, hope on my trade plans...try to learn and make your own strategy...Following is not that much easy...I AM NOT RESPONSIBLE FOR ANY LOSSES IF U TOOK THE TRADE ACCORDING TO MY TRADE PLANS....THANKS LOT..CHEERS


USDSGD Target Price 1.36933USDSGD. Waiting For Price To Reach 1.36933.
Weekly Time Chart
Daily Time Frame Chart For Pin Bar On August-4-2021 (Replay Chart)

USD/SGD: FUNDAMENTAL ANALYSIS+PRICE ACTION & NEXT TARGET|SHORT🔔The final Singapore GDP for the second quarter decreased 7.2% quarterly and increased 14.7% annualized. Economists predicted a decrease of 2.0% and an increase of 14.2%. Forex traders can compare this to the previous Singapore GDP for the second quarter, which decreased 7.7% quarterly and increased 14.3% annualized. The Singapore Current Account for the second quarter was reported at S$25.64B. Forex traders can compare this to the Singapore Current Account for the first quarter, reported at S$24.42B.
The US CPI for July is predicted to increase 0.5% monthly and 5.3% annualized. Forex traders can compare this to the US CPI for June, which increased 0.9% monthly and 5.4% annualized. The US Core CPI for July is predicted to increase 0.4% monthly and 4.3% annualized. Forex traders can compare this to the US Core CPI for June, which increased 0.9% monthly and 4.5% annualized. The US Monthly Budget Statement for July is predicted at -$307.0B. Forex traders can compare this to the US Monthly Budget Statement for June, reported at -$174.0B.
The forecast turned bearish for the USD/SGD turned bearish as the advance is closing in on its end phase. Will bears gather enough momentum to force the USD/SGD into its horizontal support area?
Check the Links on BIO and If you LIKE this analysis, Please support our page by hitting the LIKE 👍 button
Traders, if you like this idea or have your own opinion about it, please write your own in the comment box . We will be glad for this.
Feel free to request any pair/instrument analysis or ask any questions in the comment section below.
Have a Good Day Trading !
We Play In A Re Distribution .We are in a re distribution on USDSGD and i predict approximately 5 years from now to end , i normally make long term sell investment on this situations but on shorter term perspective we finished a re accumulation inside of this re distribution we can get a short term long and targeting 1.46 , but we have to be aware we are in a long term choppiness on this pair .

Daily Forex Charts Tuesday 10th August 2021Here are 4x new trade setups on the Forex Daily charts. You can refer to my notes on the chart and also my audio from the video. Cheers. Jim


USDSGD// SwingHuge spread, possible entry on a slight pull back. Price has a long way to go.
Prev analysis linked.
USD/SGD (INTRADAY!) short possibility!Hello traders,
Exotic pairs are not often to good for daytrading because of the higher spreads they calculate for these pairs.
But here is a pretty nice setup where we can have a solid entry with a pretty tight stoploss and a solid profit-point.
Structure first needs bearish momentum before we take our indicators and check the entry point.
So keep an eye on this one.
Kind regards.


USDSGD top-down analysisHello traders, this is the full breakdown of this pair. We will take this trade if all the conditions are satisfied as discussed in the analysis. Smash the like button if you find value in this analysis and drop a comment if you have any questions or let me know which pair to cover in my next analysis.

COT CURRENCY REPORTAUD, NZD & CAD:
The fact that the AUD is now the second largest net-short position among the majors does not really surprise given the recent string of negative factors such as the virus situation, slowing economic data in China and falling Iron Ore prices. This week we have the RBA policy decision coming up and markets want to know how stressed the bank has become given the recent challenges.
It seems that consensus is expecting the bank to cancel their planned tapering that would have started in September, with more aggressive bets forecasting the bank to announce a higher pace of QE at this week’s meeting. Either way it will be an important one to watch for the AUD.
For the NZD and CAD continued to move closer to neutral positioning. For the CAD this was hardly a surprise given the stretched positioning to begin with, but the NZD was a surprise with the currency not being able to take meaningful advantage of the most hawkish central bank among the majors.
This week the quarterly employment data from New Zealand will be crucially important as it will be the last big ticket data points before the August RBNZ policy decision and could either seal the deal for a hike or could push back some of those expectations in the event of a very big miss.
JPY, CHF & USD:
The JPY remains the biggest net short among the majors, and surprisingly has failed to take any real advantage of the drop lower in US10Y. Given the wash out in treasury positions and the move towards 1.14% in US10Y the JPY has not really taken the bait to appreciate as one would have thought.
Thus, even though the currency remains oversold from a positioning point of view, it does show that there is some possible asymmetry in long USDJPY right now as a move lower in yields have not negatively affected the pair, and at these lows the probability is skewed towards US10Y upside.
For the Dollar, it’s going to be a very data heavy week with the main event being Friday’s July jobs report. As the Fed’s focus has shifted away from inflation and towards the labour market, the jobs data will be watched closely as a gauge to see whether we are moving towards or away from the Fed’s goal of ‘substantial further progress’. Make sure to also keep track of the data points feeding into Friday’s NFP such as the two ISM PMI reports as well as the ADP National Employment data.
GBP:
The Pound is still in a net-short positioning despite the fundamental outlook still remaining bullish for the currency. That is a positive in our view as it shows that a lot of the frothy positioning has been flushed out after the June FOMC meeting.
This week the main event for the GBP will be the upcoming BoE policy decision coming up on Thursday. With hawkish comments from BoE’s Saunders, some participants have argued that we could see a possible dissention at this week’s meeting on whether to continue with QE or whether to cut back.
For now, it seems premature for the bank to cut purchases with the furlough scheme still needing to be unwound. The bank would arguably want to see how the labour market holds up before they commit to normalization, and that means waiting until at least October, in which case they would only have about 6 weeks of purchases left, which means the higher likelihood right now is that QE runs out as expected.
EUR:
For the EUR net-long positioning has continued to fall with the data updated until 26 July. As expected, the EUR managed to grind out some mild gains against the greenback, but unfortunately given the choppy price action going into FOMC we weren’t able to benefit the rewards and was taken out at break-even on our long EURUSD positions.
This week, with a light calendar for the EUR it’s going to be a very Dollar focused week for the EUR in general. The weak bearish bias remains intact fundamentally, so any continued upside in EURUSD into key resistance areas could set up some interesting shorting opportunities.
However, with such a busy data week ahead, it might be best to wait for data points before engaging the market, especially as we are now officially in the thinner liquidity and lower volume month of August, we might be in store for some choppy price action in between key data points.


Falling Wedge PatternFalling wedge pattern is a reversal chart pattern that changes bearish trend into bullish trend.

USDSGD-Wave b) in progress may be simple or complex to 1.34 ?Market Commentary:
LEARNING ELLIOTT WAVES IS LITTLE BIT TOUGH (FOR ME IN BEGINNING) BUT I TOOK IT AS A CHALLENGE AND THAT IS NOT IMPOSSIBLE ALSO...
First have an look for the positional trend i shared here previous....if you are a follower of me...and sometimes i will share the counter trend trade also in 15 mins and 1hr...but that is risky ones...so if the trend is bearish or bullish, if i am expecting the correction...book the profit there and wait the correction to end and again go with the trend....DONT TRADE THE COUNTER TRADE SETUP...you will took loss too...try to identify the short term pull back and the long term pull back after that took small lots in the short term PB with strict stop and go with big lots in the trend side that is long term. I WONT TOOK ALL THE TRADE PLAN SHARED HERE...
Read the market commentary inside the chart what i shared here carefully and try to learn Elliott waves...otherwise its tough to understand the market commentary and my analysis. I wont give a entry, stop loss and take profit in my chart...it is only for EDUCATIONAL PURPOSE and i am sharing how i am analyzing the pair and labeling them according to the Elliott wave theory...I AM JUST SHOWING THE TREND HOW IT MAY GO AND MY VIEW(it may wrong too)..so DON'T FOLLOW BLINDLY MY CHART..take this as a reference and if it correlate to you strategy took the trade as per your strategy...DON'T ASK ABOUT YOUR RUNNING TRADES i wont comment on them and I WONT SUGGEST TO TAKE MY TRADE SETUP.
I am a technical analyst based on trendline, channel, fib retracements, expansion, stochastic for divergence, EMA's and MA's are finding the pull backs and MAJOR IS ELLIOTT WAVES...those mentioned above are using as a TOOLS only. I am not a fundamental, sentimental trader...but only the fundamental will boost my technical analysis to reach my target or sometimes it will go against me and then i will manage the trade according to the Elliott waves alternate views...Each and every trade plan i am sharing here has a alternate view and i am sharing only the most probabilities(70-80%) here...sometimes the other (20-30%) may market do..then i will change the wave counts and labeling according to the price action.
All labeling and wave counts done by me by manually and i will keep change according to the LIVE MARKET PRICE ACTION. So dont bias, hope on my trade plans...try to learn and make your own strategy...Following is not that much easy...I AM NOT RESPONSIBLE FOR ANY LOSSES IF U TOOK THE TRADE ACCORDING TO MY TRADE PLANS....THANKS LOT..CHEERS
