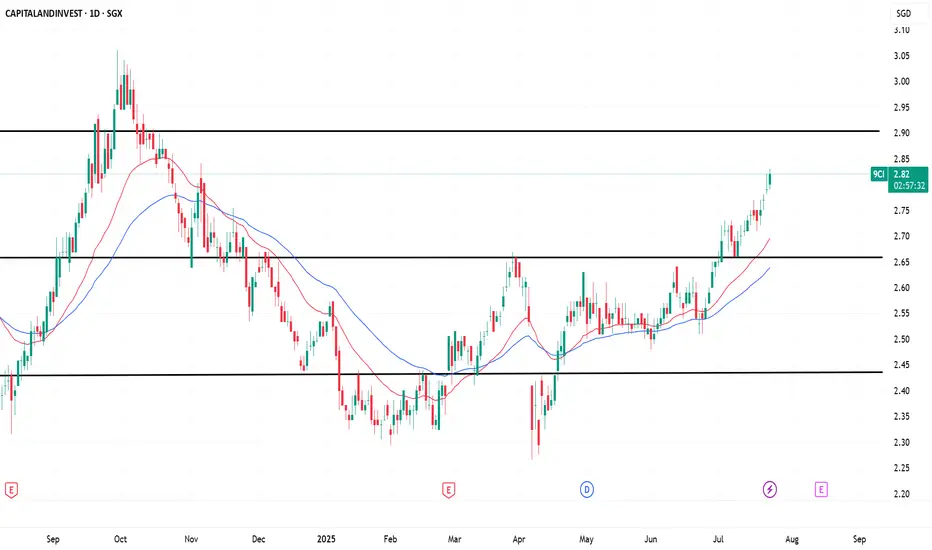
Capitaland Invest (SGX: 9CI) Uptrend – Next Resistance: $2.90Price is approaching key resistance near SGD 2.90, following a strong bullish breakout above the 2.66 support zone. A successful breakout could open the door for further upside.
9CI trade ideas
CapitaLand (9CI) Ready to Soar? Watch This Key Level!By Eric Lee , Sales Director of Phillip Nova
CapitaLand Investment (SGX: 9CI) has been in a downtrend since October 2024, falling from its peak of $3.20. However, recent technical signals suggest that accumulation may be taking place, with a potential breakout on the horizon. The volume profile indicates significant trading activity in the $2.40 to $2.60 range, which could signify either accumulation or distribution. Given the bullish signals emerging from other indicators, accumulation appears more likely.
The stock has recently broken out of a Bollinger Band squeeze, typically a sign of increased volatility. The price action suggests buyers are stepping in, pushing the stock above short-term resistance levels. The Know Sure Thing (KST) momentum indicator, displayed in the lower panel, is in a strong upward trajectory, reinforcing bullish sentiment. This suggests that positive momentum is building, potentially supporting a move higher.
Key levels to watch include $2.63 as immediate resistance, with a breakout above this level potentially confirming the bullish trend and setting the next upside target around $3.00. On the downside, $2.40 remains a critical support level. A failure to hold above this level could indicate further weakness. Investors and traders should watch for confirmation signals before taking positions.

Golden cross on CAPITALAND INVESTMENT 9C150 crossed above 100 and 200 first time in awhile
need to see a convincing support level established above 2.9$ area before rebound to break long time resistance at $3.2
TP to watch is $3.5

CAPITALAND Investments (9C1) - BUY!BUY: $2.8 - $2.95
TP:
$3.44
$3.68
CapitaLand Investment will be a major beneficiary of lower rates from income growth for its REIT holdings and enabling accretive fee transactions. Another positive is the massive re-rating of China following the recent monetary stimulus by the central bank and support by the Politburo will benefit the economy indirectly. Similar to the Fed’s quantitative easing, it will be the wealth effect of higher equity and bond prices that boosts confidence and spending. It also encourages borrowing as households and private enterprises are deleveraging despite the record-low interest rates.
Personally. I am buying and holding for my long term dividends portfolio.

Capitaland Investments Share Price Soars Following CLCT's 50% AcCapitaland Investments' share price surged today after its managed fund, Capitaland Integrated Commercial Trust, announced a 50% acquisition of its portfolio property, Ion Orchard. The share price has experienced two fake breakouts in the past, with the latest breakout occurring two days before the acquisition announcement. Let's see whether the share price can sustain this momentum.
