O87 trade ideas

Call debit spread - GLDBuy a call debit spread Gold, just to hedge my portfolio, with a low IV rank hence why I did a debit spread.
Anything below 20 IV Rank is when I do a debit spread, and Gold has been smashed to the down side.
Its below my 160 call, so I just have to wait until it goes back up to 160, if it drops more then I have to roll credit call below 160.

Opening (IRA): GLD July 16th 145 Short Put... for a 1.38/contract credit.
Notes: Here, I'm looking to establish a GLD position and/or acquire shares via short put ladder. Currently, I've got the April 16th 164's, May 21st 155's, and June 18th 149's in addition to this rung. I'm looking to acquire shares, so am fine with getting assigned and selling call against as part of a portfolio largely consisting of broad market (SPY, IWM, QQQ, DIA), treasuries/bonds (TLT, HYG, EMB, AGG), and precious metals (SLV, GLD).


GOLD - An IntroductionChecking in on Gold to see if there is a correlation to BTC. It is in the wake of Diamond that broke bear with a hint of an inverse H&S on the longer frame.

How to use the RSIHi guys, today I will be explaining how to use the Relative Strength Index (RSI) to your advantage. First of all if you have not already, please follow me. Okay, so the RSI is commonly said to buy when oversold and sell when it is overbought. However, this strategy does not always work, and can result in you predicting what the security will do.
First Step: You should first check to see if the RSI is making higher lows, or lower lows. This is important because it can show whether the asset has strong buying pressure or weak buying pressure. I call it buying pressure because the index essentially represents the demand for it. So, why would you short something, when tons of people are buying in? However, the index can work short term, if you are day trading, but does not work as well for swing traders. If you see a rising RSI it is a good sign, and the opposite for a falling.
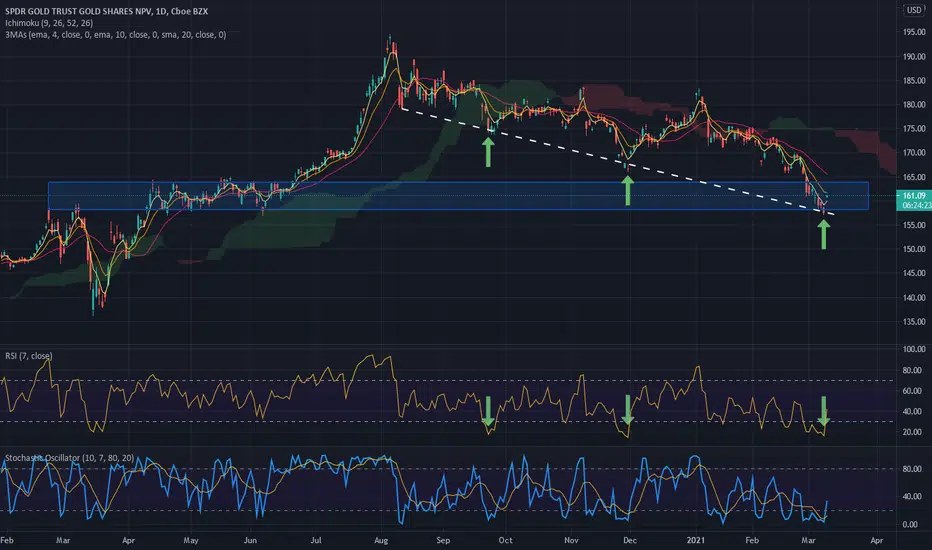
Second Step: This is a step where most people don't do, but I think is very important. The step is to check whether or not the asset has an RSI that is hitting overbought, or hitting oversold. In this example, Gold is hit oversold two times. This proves how weak gold is and why it could have a breakdown. Another thing to check in this step is if it stops falling at the oversold level and does not fall beneath. If this occurs, it is a great sign because it shows that the asset is strong. For Gold, it had done that, and if you had spotted that you could have made 40%! In sum, the second step is to see if the asset is hitting overbought levels (good), or hitting oversold levels (bad).
Third Step: The next step is to draw support and resistance levels, look at other indicators, etc. You could even look at fundamental data to support your technical data.
Last step: Your last step is to place you limit order, and or stop order.
Thanks for viewing guys, and please like and follow. Thanks!

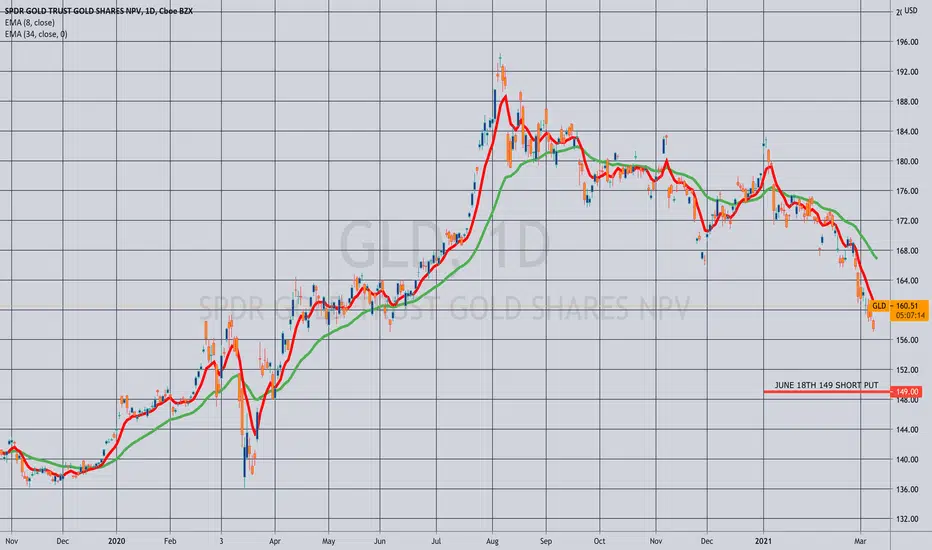
GLD about to break!Hey guys, if today I am doing GLD, and showing how it could be a really cool short. Firstly, lets start with the background. So, because of all the inflationary items like stimulus checks, relief items, and other things that have helped our economy come back from a crash, it has helped commodities. This is because when the dollar becomes less valuable as there is more inflation, Gold naturally rose to combat this. Anyway, it peaked in august and has been falling since. In the end of February, it had the 200 MA cross above the 50 MA, which is the most bearish you can get, but also broke through the support. Luckily, GLD has another support level right beneath it. People are now saying that it is a good buy because it is at a really good support level, but I would say the opposite for a few reasons.
Technical Analysis: Firstly, when the stock came back up to test the resistance level which had acted as its former support, it never came above it. Keep in mind that the stock is still at the resistance level, so it is not as definite, but technically it does not look like it will break above it. Secondly, the 200 MA broke above the 50 MA and this is the most bearish it can get. Also, the 200 Moving average is sloping down, and this has not happened in over a year. The 20/50 MA are also sloping down, but they are not as important as the 200 MA. Thirdly, the RSI which to me is a measure of the buying pressure of the stock has ben moving down the last few months. Recently, it has also been hitting oversold conditions, which is also very bearish because it shows that the stock is getting weak. This proves how weak GLD is.
Fundamental Analysis: Firstly, we have rising rates that are combating the inflation rate. Secondly, as our economy improves and rates keep inching higher, our dollar will recover. When the dollar rises it is terrible for commodities because cash is getting more expensive and this is why prices fall.
Intermarket Analysis: I wanted to add this in because I thought it would be really cool. Anyways, historically the Yen is very correlated with Gold. So, if you saw my chart, the Yen had ben rising for a few months but has recently broke below support. It has been falling more and more the last couple of weeks. This shows us that the same could happen to GLD since they are so correlated.
This is all, but please like and follow. Thanks!


Recent gold moves resemble the 2012-2013 topWith bonds rallying a bit, it's possible we will see gold break upward out of its recent downtrend. I can't help but compare gold's recent moves to the 2012-2013 top in gold. We look to be making a very similar pattern, but on a compressed time scale. Long term this comparison implies that gold will move downward from here, but short term, if the comparison holds, we could see a rally through the first resistance line to at least make a test of the second resistance line.
Personally, rather than buy gold directly, I've bought some Barrick Gold. I figure if I'm going to bet on gold, I might as well get a stock with a dividend. (I'm also just better at placing valuations on equities than on metals, so I usually prefer to bet on metals indirectly by buying stocks.) I should note that buying miners works a little differently than directly buying metals, because geopolitical events that are good for gold are sometimes bad for miners because they negatively impact production. In any case, Barrick has been in a downtrend along with gold, and may also make an upward break through resistance:
I have bought in anticipation of a breakout, but another way to play is to set an alert on the resistance line and buy after a breakout has occurred.

GLD bounce from channel bottom - targets 166, 171Last week GLD price came all the way down to the bottom of the blue support region and tried to push lower (below 158) but the channel support line (white) held firm. Now I am looking for price to bounce up to moving averages and/or channel top. This gives targets of 166 and 171.
The dotted pink line connects closing prices on a line chart. The solid pink line connects high prices. Since I bought April calls using very little capital, I have enough time and comfort to hold the loss and see if price moves higher. I am using the hourly and daily chart for this trade.

GLD comebackBased off my technical analysis GLD has been trading in between a channel the past few months. Recently, we saw GLD bounce off the lower end of the channel simultaneously reversing from an important resistance level at $157. This may suggest a reversal to the upper end around $169 in the coming few months. Finally, in support of the resistance at $169, volume profile shows high activity also at $169.

GLD - Rebound time?Gap filled and bought back up all day. We'll see if next week confirms a reversal, but it's still holding the longer trend line.

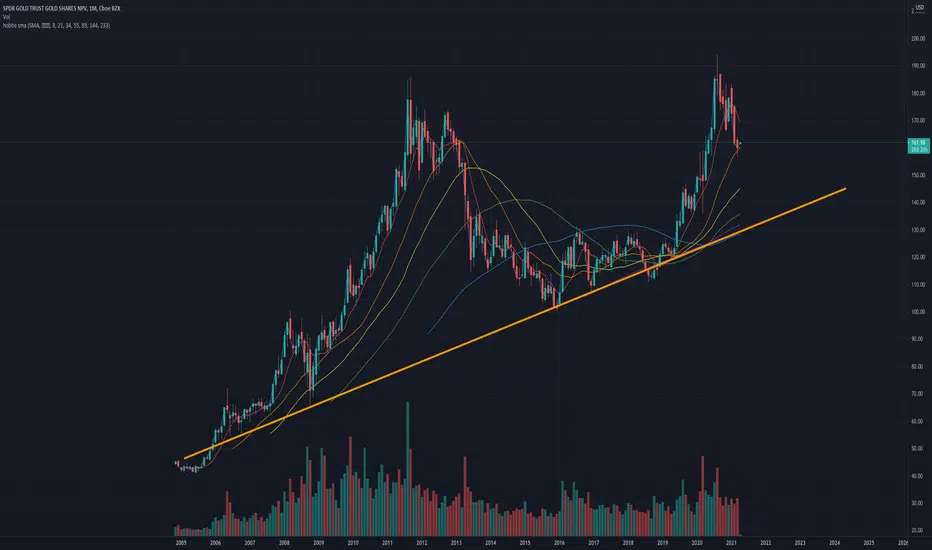
Gold: We have entered a bear cycle.This long-term chart of GLD reveals that we have entered the next bearish cycle for the Gold market. This cycle of the Gold market peaked a couple of months ago and seems to be following the same trend from the last cycle. In fact, if we use the fib-retracement tool to plot the pullback from the first pulldown from the peak, we can see that GLD has bounced up and found minor support on the 100% fib trend retracement line.
We can now expect a rise to the 61.8%-38.2% levels before falling down from there again. Be careful shorting puts or going long in those levels as we may never see another ATH for months if not years.
Trade Idea: Short GLD around $171-$180.
While it is unlikely for it to keep rising higher to new ATHs anytime soon, you can set stop-losses above at a comfortable level while leaving enough wiggle room. We can expect GLD and Gold to continue to fall from those $175 levels down below the $156 fib support, and then the 148 support area. Once the price breaks those levels, we can expect a high-velocity waterfall sell-off to the $136 support area, where we can also take some profits on the way. The key support area and the final price target is the parallel channel support around $107.5-$115, which we can expect to see in anywhere from 9 months to 5 years.

Golden Retriever GLDYea this could be pretty ugly if breaks here
Gold has walked on down to sub 1700....just broke after the Feb Jobs number down to 1690
Maybe this is the final flush out before Gold regains a bid on some inflation worries...
Though it really doesn't seem to care about that
Either way I'm getting long GLD calls here for a move back up towards 165 where there is a large open interest in the options market for March opex
If need be this trade will become a short credit spread real quick especially if USD shows continued strength

Opening (IRA): GLD June 18th 149 Short Put... for a 1.88/contract credit.
Notes: Adding a third "rung" to my GLD position out in June on this weakness. 1.28% ROC as a function of notional risk.
GLD oversold to support line + RSI low = swing callsPrice broke below the support zone, all the way to the white support line. As green arrows show, every time RSI is this low we see a move up in price. This is a big reversal open as well. I kept April calls from last week and am adding more for this move up.
Gold Bottoms TODAY.We have a weekly TD9 on GLD, and some major divergences showing up across the Gold chart. I believe today is a major swing bottom.

Wave 5 Correction. Strong downward trend. Short term down.Heavy sell off and no sign of upward momentum. All MA downward angles. Downward momentum is strong within channel. Still making LH LL.
Key support $158.35. Until it bounces off this level and shows some bullish candle patterns, I am cautious.
Preferred entry zone is below $160. Stop loss $156. But I would not take this trade yet. Very risky. It could get cheaper.


GLD possible cup and handle weekly viewGLD weekly view might be drawing a cup and handle bullish pattern. Lets wait and see.
