GLDSystem T Performances: Annual Compound Profit 40%, Win Rate 55%, Risk/Reward Ratio 1:2, 20 Years of Backtesting Data, Over 100 Markets.
* Click Like and Follow to Support My Work!
---
Hi Traders,
I'd like to introduce the System T, a computerized trading system that analyzed and backtested the 20 years history data of over 100 markets.
This post is my sharing of how I think about systematic trading and the signals generated by the System T.
(This is my opinion only, NOT the financial advice.)
I think that for the system to open a trade and manage risk, it only needs a buy signal & a stop-loss signal clearly on the chart.
Once the system finds a good trend, it will ride it as long as possible. The stop-loss will be adjusted accordingly to the new price movement.
(Remember to follow this trade idea and follow my profile to get updates about the stop-loss adjustment and sell signal based on the latest price and market conditions daily.)
System T performances above will give you an idea of how it performs in the last 20 years.
Notice that this result was achieved only if I strictly followed the rule: "Only and Always Buy & Sell based on the System Signals".
Don't sell when there is no sell signal as we all want to follow the good trends til the end like everything in life does. \(^-^)/
Also, my system is extremely diversified through over 100 markets so that it only risks less than -1% of the total capital per trade.
Thank you and good luck!
---
DISCLAIMER:
I am NOT a financial advisor, and nothing I say is meant to be a recommendation to buy or sell any financial instrument.
My views are general in nature and I am not giving financial advice. You should not take my opinion as financial advice. This is my opinion only.
Do your own due diligence, and take 100% responsibility for your financial decisions.
Trading and investing are risky! Don't invest money you can't afford to lose, because many traders and investors lose money. There are no guarantees or certainties in trading.
- Content is for education purposes only, not investment advice.
- Trading involves a high degree of risk.
- We’re not investment or trading advisers.
- Nothing we say is a recommendation to buy or sell anything.
- There are no guarantees or certainties in trading.
- Many traders lose money. Don’t trade with money you can’t afford to lose.
O87 trade ideas

GLD - H&S pattern?Could be. Looks like there are some gaps that need to potentially be filled. RSI and MACD still not favorable but FIB support for now. I see $2-$6 of downside here with any positive news from coronavirus. Perhaps to the next fib level in the $144 range. Gold has all the reason in the world to be running away from us except for the market which continues to march higher as gold treads water. This is a tough call. Little slippage into the close for the overall market. Gold not catching any additional bid. I think the path higher for gold goes through a lower number. Bought a small amount of GDX, NEM and PAAS. No new NUGT purchases yet. Chart of GDX looks like the triangle inside the triangle will resolve to the downside.
PULLBACK FOR GOLD OR ONE MORE PUSH?The region of 152.5 and 155.5 is extreme resistance for gold.
We do have a bearish divergence and resistance as well on the RSI.
Gold can either push one more leg up to the resistance are and then drop, or its possible it drops now and gets ready for this next leg up.
Anyhow looks like soon a retracement is coming.

GLDHere is a look at gold using the GLD etf (previously posted one of XAUUSD). GLD is setting up very similarly to how it did in June of last year before running up more. Break out of the wedge to form a little handle at previous highs. Wouldn't be surprised to see another gap & go towards the 0.618 retracement.

Potential downside trade for GLD.Dollar having a beautiful breakout on the daily and the market recovering pretty well after some recent consolidation. Brings in a potential trade opportunity to take a bearish position on GLD for short term.
Possible ideas: 03/06 GLD 147P for 1.0 or the 148/146P spreads.

GLD and Gold Could be Rallying into a Very Important PeakOn 9/8/19 I posted that GLD had marginally exceeded the 50% retrace of GLD's 2011 to 2015 bear market. It looked like GLD could be in a decline down to the 130 to 134 area.
GLD made a bottom at 136 and, could within about a week - rally into .618 resistance at the 153 area.
Gold Seasonal patterns are bullish into mid-February then bearish into April.
So far weekly RSI, MACD, and Stochastic have bearish divergences.
The evidence from the Sentiment dimension for all three precious metals is very bearish.
The Commitment of Traders Report each week shows the net positions of the main trading groups; Small Traders, Large Traders, and Commercials.
The Commercials have the most knowledge and money - they are the group to follow.
Platinum is just coming off the largest Commercial net short position in 20 years!
Gold Commercials are close to their largest net short position in 20 year!
Silver Commercials are close to the largest net short position in 5 years!
Follow the money - the biggest money for precious metals are making big downside bets.
If GLD can rally into the 153 area within the next 5 to 10 trading days, it could be the best shorting opportunity since the major top made in 2011.
Mark

GLD-Double top formation , AlphaOverBeta Trade AlertHello traders,
GLD was spotted on the AlphaOverBeta radar as forming ( Asymmetric) double top bearish formation, this usually means that the next move is to the downside,
The formation is incomplete and will be completed once the price pattern goes below the 145.5$ level ,
watch out for this formation since its a high probability trigger, once formed, which may trigger a bearish move in GLD for the short term,
Trade Smartly,
Alon, AlphaOverBeta

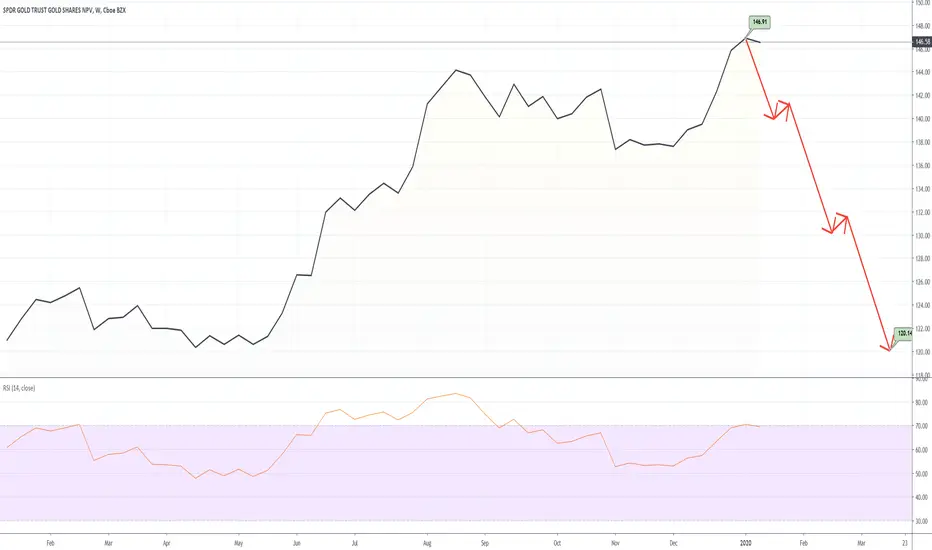
GLD - MAY ATTEMPT TO RALLY TOMORROW TOP OF DOWNTREND
0. GLD may make an attempt to move to the top of the current downtrend channel, but make no mistake about it, it is breaking down below this channel
and following the major downtrend to $120 that will unfold, related to Chinese slowdown, and the non-purchase of it as jewellery, which is 60% of it's usage worldwide.
1. Kitco already reported horrid 2019 Gold numbers, and confirmed a long term downtrend.
2. Gold only caught a bid due to "negative rates", "The election uncertainty", and "Corona End of The World BS";
3. Long term trend is down to the $120 area easily as outlined by both Morgan Stanley and Goldman back in the fall, when they said to take
profits at $145, and wait for $120 to enter back in. That will come true soon.
- drchelsea.

GLD - BEARISH ASCENDING WEDGE, SUPPORT AT $145 NEXT STOP
0. Notes to follow;
1. We logged a massive profit from this idea yesterday, and it is just getting started.
2. It will take time for the Gold Hedge to unwind. $1200 on GOLD itself, maybe $100 - $120 Zone, is the permanent sine wave support area and will head back there.
3. As predicted the double top at $150, and the Head and Shoulder Break today, as predicted, show the downside is path of least resistance here.

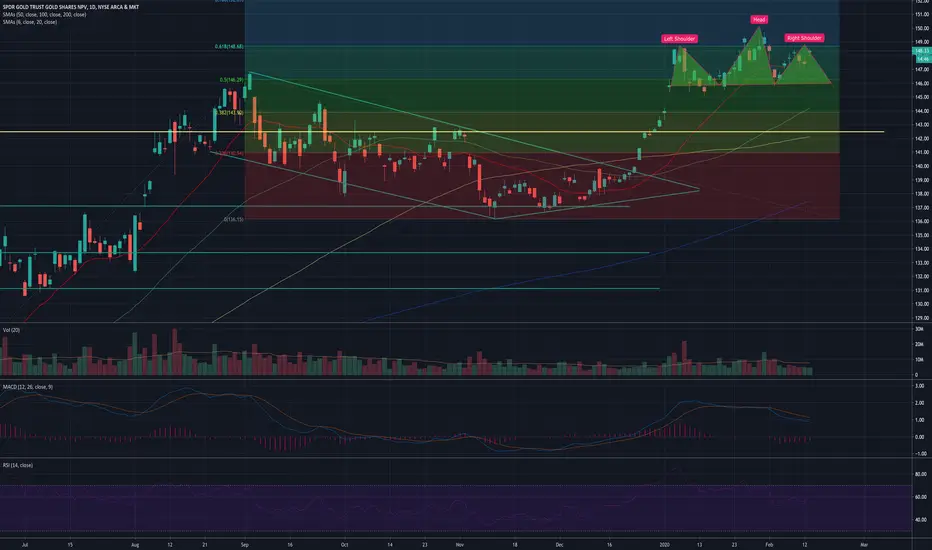
GOLD (GLD) - Head and Shoulders Top - Down we go
1. This Gold nonsense is in the final days, and then the bottom drops out. Final shot at $150, and not happening.
2. Double top.
3. Head and Shoulders Pattern, All day long.
4. Expecting a break back to $146.60;
5. Once this give, $140 is next, and it will happen in about 2 hours;
6. Stay tuned;

$GLD Runs on Growing Fears of Global PandemicGLD has been a beneficiary of fears related to the Coronavirus outbreak launched from Hubei Province, China a couple weeks ago.
GOLD (GLD) - ABBVIE CORONAVIRUS CURE? Longs have Issues...This is just getting ridiculous with the rush to gold. It is go time:
AbbVie has undergone a robust rally from the summer lows, ripping from a low near $61 to a high near $91. That’s about a 50% move in less than six months, and AbbVie stock was doing a good job consolidating the big run up.
If Abbvie has a cure, you are all dead, like the virus:
A 35-year-old Seattle-area man identified as the nation's first person with coronavirus developed pneumonia while in the hospital but has improved after getting antiviral medication, according to a new study.
A report published Friday in the New England Journal of Medicine said the Snohomish County, Washington, man remained in the hospital as of Thursday and has no symptoms other than a cough that is improving.
The study, which describes the man's symptoms and treatment but does not identify him, provides the most detailed look among the six reported cases of coronavirus in the U.S. On Thursday, the CDC and Illinois state health officials reported the first U.S. case of person-to-person spread of the illness – the husband of a Chicago woman who developed symptoms after visiting China.
Public health officials warn that there are likely to be more U.S. cases, including the possibility of limited person-to-person spread of the respiratory virus, but they emphasized the risk to the public remains low. The outbreak has infected nearly 10,000 people, mostly in China, and killed more than 200 there.
More Virus Notes and Possible Cure Here:


GLD on a downtrendAMEX:GLD appears to have completed a bearish harmonic butterfly pattern on Monday. Monday's filled green candle and yesterday's red candle confirms the pattern. A daily stoch cross is also evidence of a downtrend.

Trading Edge 2020 Portfolio -Trade #2- GLD - Golden OpportunityPosition:
- Long dated call options
- Jan 15th 2021 expiry
- $137 Strike
- 0.71 Delta (ITM)
- Cost = $12.10/ contract
- Buy 1x contract
Profit Target/ Exit:
- $150 initial profit target
- Two closes below $136 is exit signal (this would be around a 50-60% stop)
Rationale:
- GLD has broken out of the descending channel (period of consolidation)
- Bullishly stacked moving averages
- GLD can also act as a potenital hedge against other market long positions (MJ for example) should we experience a market pullback in Q1
- Bullish MACD cross and moving averages cross
- Longer dated options give more flexibility in allowing the trade to develop, also gives us the ability to roll the contract to lock in profit and stay in the trade
- GLD has had quite a nice move up recently and is at the 3 ATR on the daily, so a slight easing is possible, but any ease should not take us below our stop, if this breakout has any legs
- Trading Edge

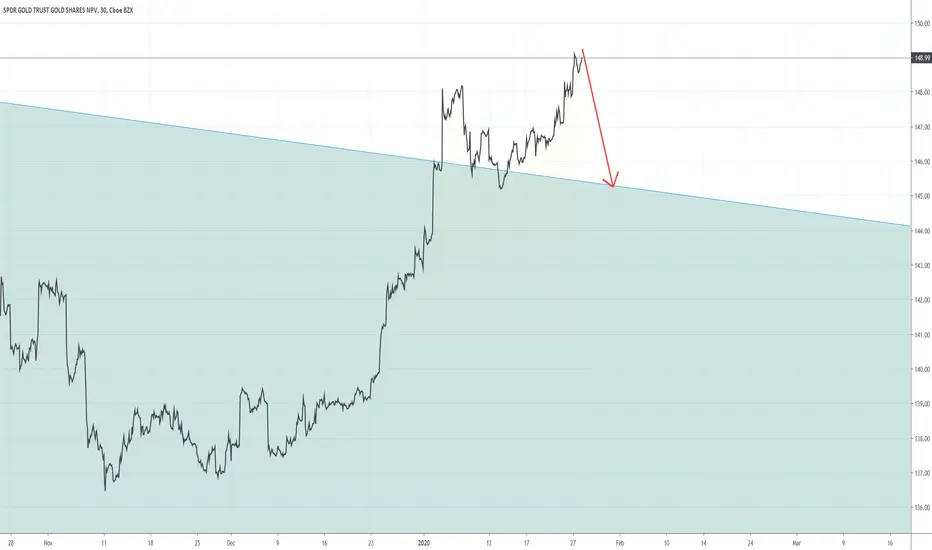
GLD - TIME TO HEAD BACK INTO THE CHANNEL NOW / VIRUS CHINA ONLY0. We don't believe that $149.25 will be breached again.
1. All down from here;
2. Stay tuned.
GLD - BEST SELLING OPPORTUNITY YOU WILL EVER SEE.0. Okay, we are selling into strength. This is a scam:
www.cnbc.com
Chinese Services Sector takes a 1 percent GDP hit in the 2020 first quarter.
Also, this:
finance.yahoo.com
The U.S. needs to take China down, they are getting too big:
1. Long OIL
2. Short GOLD
3. Long U.S. Equities.
4. Short VXX
Ready to rock. Buy when others are fearful and sell when others are greedy.
Time to dump GLD gents.

GLDSystem T Performances: Annual Compound Profit 40%, Win Rate 55%, Risk/Reward Ratio 1:2, 20 Years of Backtesting Data, Over 100 Markets.
* Click Like and Follow to Support My Work!
---
Hi Traders,
I'd like to introduce the System T, a computerized trading system that analyzed and backtested the 20 years history data of over 100 markets.
This post is my sharing of how I think about systematic trading and the signals generated by the System T.
(This is my opinion only, NOT the financial advice.)
I think that for the system to open a trade and manage risk, it only needs a buy signal & a stop-loss signal clearly on the chart.
Once the system finds a good trend, it will ride it as long as possible. The stop-loss will be adjusted accordingly to the new price movement.
(Remember to follow this trade idea and follow my profile to get updates about the stop-loss adjustment and sell signal based on the latest price and market conditions daily.)
System T performances above will give you an idea of how it performs in the last 20 years.
Notice that this result was achieved only if I strictly followed the rule: "Only and Always Buy & Sell based on the System Signals".
Don't sell when there is no sell signal as we all want to follow the good trends til the end like everything in life does. \(^-^)/
Also, my system is extremely diversified through over 100 markets so that it only risks less than -1% of the total capital per trade.
Thank you and good luck!
---
DISCLAIMER:
I am NOT a financial advisor, and nothing I say is meant to be a recommendation to buy or sell any financial instrument.
My views are general in nature and I am not giving financial advice. You should not take my opinion as financial advice. This is my opinion only.
Do your own due diligence, and take 100% responsibility for your financial decisions.
Trading and investing are risky! Don't invest money you can't afford to lose, because many traders and investors lose money. There are no guarantees or certainties in trading.
- Content is for education purposes only, not investment advice.
- Trading involves a high degree of risk.
- We’re not investment or trading advisers.
- Nothing we say is a recommendation to buy or sell anything.
- There are no guarantees or certainties in trading.
- Many traders lose money. Don’t trade with money you can’t afford to lose.

Still long GOLD, since 2009 [DETAILED]Gold is still a preferred long term asset for wealthy individuals & governments. I've been long since I got into financial markets back in 2008. A wealthy client of mine (whom I did sports recovery on from a Pro Baseball career) suggested I buy gold back then. I had no idea about it, I just bought it & held on. I sold it around 2011 to start another business & have continued to be an investor/trader since.
Currently awaiting to continue buying pullbacks to the (long term) green line. This is a wealth play that I expect to simply hold long term. I BUY PHYSICAL GOLD & track the price value with the chart. You must understand market economics & the historical valuation of GOLD to understand why I approach it this way. GOLD IS NOT A "SAVE THE DAY" ASSET. It is simply a part of a long term asset building strategy to add to a balanced portfolio.

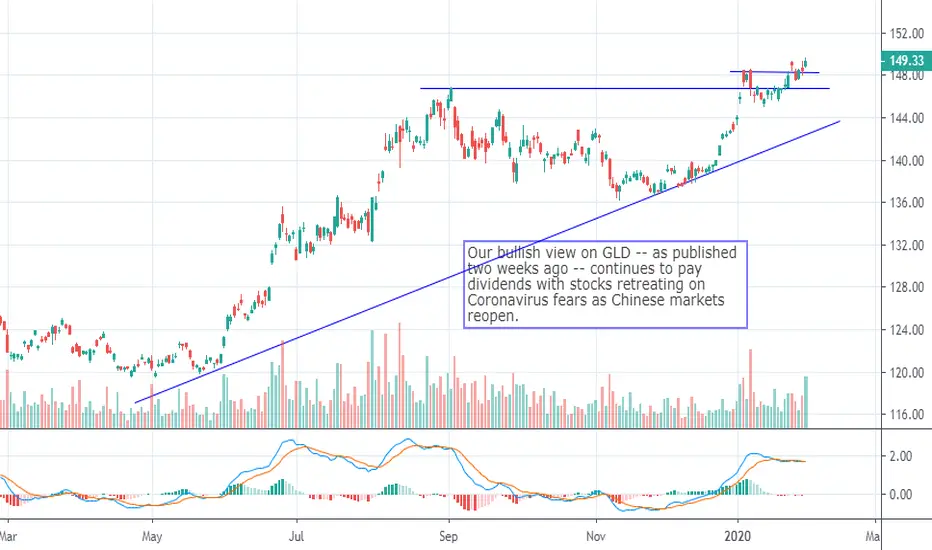
$GLD Continues to Perform in a Major Bull TrendGLD
The gold market has been in trending mode, with central banks, geopolitics, and even biology helping to foment the action. While CFTC data shows something resembling a crowded long trade in place, gold can continue higher under such conditions, just as it did in 2010, when CFTC data showed an all-time high in speculative long positioning BEFORE the big parabolic run higher.

GLD - Adding more to OUR SHORT POSITION $146.750. GLD just putting in a terrible performance today.
1. Corana Virus and Doomsday Nonsense, and $146.75?
2. In a downward channel, and going to break down any day;
3. #1 Topic right now at Davos - ASSET ALLOCATION / OUT OF GOLD AND INTO WHAT??

GLD/SLV RatioStill watching this closely. At $8.71 we are right between the $9.40 top and $8.00 low that coincided with the summer 2019 run in the metals. We are running out of time and space and the continuation pattern to the downside (silver increasing on a percentage basis at a faster pace than gold) should happen soon. Market melt up is only thing keeping this from happening sooner. This time pattern lines up with VIX spiking and market selling off. Keep on eye on this.

GLD - HOW AND WHEN TO SHORT IT - NEW IDEA / January 23rd EOD!0. Okay so follow along on this one, I will make it quick;
1. Last time GLD corrected, it was around the $145 Level;
2. It was September 4/6 2019, and it went from $145 to $140 in a matter of like 2 hours (just memory, I was short that day);
3. It rebounded off the $140 support level ;
4. PUT options on the $140 are dirt cheap, and GLD owners see that as support.
5. March 20 2020 $140 PUT - $38 cents a contract- so you can go 1000 shares short for $380 + fees.
6. GLD should SPIKE on January 23rd 2020. This corresponds to the Intel ( INTC ) earnings release;
7. Many believe that INTC may tank the market, as it kicked off the 2000 crash in March;
8. Algorithms are primed to either take this market to 3850, or to 3100 based on earnings ;
www.cnbc.com
9. GLD people will load the boat on the 23rd and create a blow-off top;
0. At 3:45pm you will buy GLD March 20th 2020 $140 PUT for < $30c a contract. Throw $300 at it. If you want to take a larger position, you will need a UVXY hedge to counter this unless you are okay losing the premium. But remember you have 60 days for the New Bull Market to take hold, and the Gold Hedge to Unwind. That should be plenty of time. So just buy enough UVXY to cover the $X you spend on GLD Puts. So if you spend $10K on GLD puts, you need to hedge 10K against a meltdown. You use the UVXY to do this. VXX may not be the best hedge right now, UVXY is better (can't explain right now - no time - inefficiencies in the VIX ). If the market corrects, UVXY goes from $10 to $30 in about 2 minutes. So a $1000 purchase of UVXY would be $3000. Anyway, you need a married put or call spread to do this. This is the perfect straddle. So you would also on the 23rd of January buy a married put on the UVXY . So you buy the January 31st UVXY $10.50 put for 50c or whatever, and that give you a week with total protection, against INTC and AMD . All crashes up the 31st of January will only cost you about $500 US for 1000 shares of UVXY for a week. If the market crashes you make $20000 US in about 2 minutes when UVXY spikes to $30, and that is okay, as your $500 puts are worthless, but the stock has a delta of 1.0 so whatever you sell it at, minus $500 is your profit.
1. If you do this, you need to carefully watch the market next week.
2. If INTC raises guidance or beats, or whatever happens and the stock actually goes up on a tear, then GLD is really finished. Gold would probably be around $120 by the end of March and you will be $20K richer, for just a $300 risk/reward.
3. I don't know about you, but this is a nice setup.
4. I also don't think there will be any stops along the way.
5. You need options to do this;
6. So. You can buy all the semiconductors CALLS on the March 20 Strike you like and ALL the GLD PUTS on the March 20 $140 Strike, and just hedge the whole thing over earnings for about $500 bucks. Then you know the direction, and you run with it baby!
7. If you haven't been following my AMD thread, you have really missed out. Been trading it personally and we manage an investment trust on AMD as well. We are long from ~$28 and shares will have to be pried from our cold, dead, hands...
- The AMD Whisperer