Is SPY Positioned for a Rebound or Continued Decline?Data Speaks About SPY:
1️⃣ Trading above key support zone (480/495): The stock is holding above critical levels, which suggests a potential for stability or a rebound if these levels hold.
2️⃣ Below 10-day MA: Currently trading below the 10-day moving average, indicating short-term bearish sentiment and lack of upward momentum.
3️⃣ Failed attempt to re-enter downward channel after sharp decline: Despite a brief attempt to recover, the price failed to re-enter the downward channel, signaling persistent selling pressure.
🔽 Outlook: While the stock shows oversold conditions, the bearish momentum is still intact. However, as long as it stays above the 480/495 support zone, there’s potential for a rebound.
S27 trade ideas

Trump's Tariff Wars : Why It Is Critical To Address Global TradeThis video, a continuation of the Trump's Tariff Wars video I created last week, tries to show you why it is critically important that we, as a nation, address the gross imbalances related to US trade to global markets that are resulting in a $1.5-$1.8 TRILLION deficit every fiscal year.
There has been almost NOTHING done about this since Trump's last term as President.
Our politicians are happy to spend - spend - spend - but none of them are worries about the long-term fiscal health of the US. (Well, some of them are worried about it - but the others seem to be completely ignorant of the risks related to the US).
Trump is raising this issue very early into his second term as president to protect ALL AMERICANS. He is trying to bring the issue into the news to highlight the imbalances related to US trade throughout the world.
When some other nation is taking $300B a year from the us with an unfair tariff rate - guess what, we need to make that known to the American consumer because we are the ones that continue to pay that nation the EXTRA every year.
Do you want to keep paying these other nations a grossly inefficient amount for cheap trinkets, or do you want our politicians and leaders to take steps to balance the trade deficits more efficiently so we don't pass on incredible debt levels to our children and grandchildren?
So many people simply don't understand what is at risk.
Short-term - the pain may seem excessive, but it may only last 30, 60, 90 days.
Long-term - if we don't address this issue and resolve it by negotiating better trade rates, this issue will destroy the strength of the US economy, US Dollar, and your children's future.
Simply put, we can't keep going into debt without a plan to attempt to grow our GDP.
The solution to this imbalance is to grow our economy and to raise taxes on the uber-wealthy.
We have to grow our revenues and rebalance our global trade in an effort to support the growth of the US economy.
And, our politicians (till now) have been more than happy to ignore this issue and hide it from the American people. They simply didn't care to discuss it or deal with it.
Trump brought this to the table because it is important.
I hope you now see HOW important it really is.
Get some.
#trading #research #investing #tradingalgos #tradingsignals #cycles #fibonacci #elliotwave #modelingsystems #stocks #bitcoin #btcusd #cryptos #spy #gold #nq #investing #trading #spytrading #spymarket #tradingmarket #stockmarket #silver

SPY/QQQ Plan Your Trade For 4-9 : Top/Resistance PatternToday's pattern suggests the SPY/QQQ will attempt to move a bit higher in early trading - trying to identify a resistance area. Then, roll over into a downward price trend.
Be cautious of the overnight price range, potentially already setting the upper boundary of the TOP pattern for today. It can happen that overnight trading sets a PEAK/TOP, and we move into sideways/downward trading related to the current TOP/Resistance pattern.
I believe the US markets will attempt to move upward, toward the $490-500+ level before topping out today. I believe this move will be related to the strong support near the $480 level and will attempt to further establish the downward price channel established by the big breakdown in trend over the past 9+ days.
Ultimately, I believe price is struggling for direction, but I also believe this process (with tariffs) is working out as expected.
This is obviously a very volatile market - so stay cautious as we move into a more consolidated price trend over the next few weeks.
I don't expect the markets to try to make any really big moves over the next 2+ week (unless news hits). At this point, I believe the markets will try to UNWIND the volatility over the next 2+ weeks.
BTCUSD is trading near the lower range of the consolidation phase. This could be the start of the breakdown to the Ultimate Low.
GOLD and Silver are moving higher after forming the base (just as I expected). Metals will likely rally strongly as global fear elevates.
Thank you for all the great comments. I'll try to publish a few new videos today and tomorrow to help everyone out.
Remember, price gives us new information every minute/bar. It is a matter of unraveling the puzzle with price - one bar at a time.
If you like what I do, follow along.
Get some.
#trading #research #investing #tradingalgos #tradingsignals #cycles #fibonacci #elliotwave #modelingsystems #stocks #bitcoin #btcusd #cryptos #spy #gold #nq #investing #trading #spytrading #spymarket #tradingmarket #stockmarket #silver

Trumpenomics - Market Volitility - How low will it go?What we know:
When Trump entered office he said the stock market was too high and he was not investing in the markets.
The Tariffs have caused volatility and a decline in the markets.
Market drops in the past have been between 30% and 60%.
How far do you think the market will drop this time?

Yesterday's SPY shorts - Analysis on entries and algorithmsThis is more of a review of how I utilized the algorithms and HTF intention targets to place strategic option trades yesterday on the SPY LTF (and middle time frame as I left some runners overnight.)
Happy Trading :)

Spy what I see with my little eyeTraders,
Fear, trade wars, WW3, Tariffs and a bunch of I told you soo's..... "You voted for this!" just a bunch of chirping. Because this man got to being a billionaire being a silly goose yeah? What happens when them 401k's start 3x'n, what happens when we see one of the biggest bull markets we have experienced in our lifetime?
I don't know much but I know this..... the bull market may not be over. Just taking a break!
Enjoy the hopium!
Stay Profitable!
Savvy

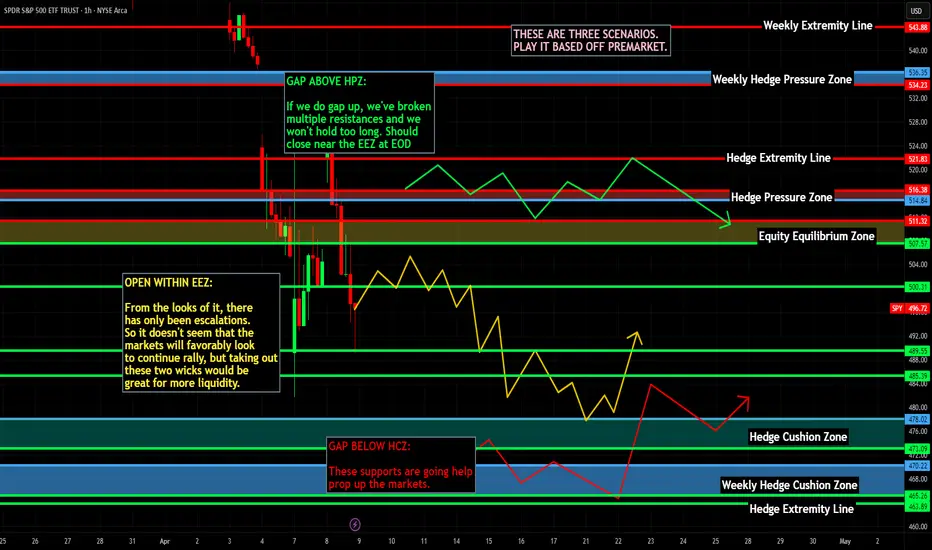
The "Bearish" Short-term Outlook on the marketI apologize - this video was made mid-market yesterday and took a while to download for some reason. So we did subsequently close below the gap and continue downward wherein we closed the multi-day cup at the former low.
I am shorting this overnight and allowing for the subsequent liquidity build to happen (if necessary) before shorting again. There is plenty of more room to the downside if our strong selling was proven (which it seems it was with the incoming gap down).
Happy Trading :)

$SPY $482 needs to hold or we hit $450SPY - SPY has weekly trendline support at $482. Key level where it bounced from this week. If fails to hold that level we have support at $460 and $438. Spy is losing strength on the indicator. High watch

Nightly $SPY / $SPX Scenarios for April 9, 2025🔮 🔮
🌍 Market-Moving News 🌍:
🇺🇸📈 Implementation of New U.S. Tariffs: As of April 9, the U.S. has imposed a 104% tariff on Chinese goods, escalating trade tensions and raising concerns about a potential global economic slowdown.
🛢️📉 Oil Prices Decline Sharply: In response to escalating trade tensions, oil prices have fallen nearly 4%, reaching their lowest levels since early 2021. Brent crude dropped to $60.69 per barrel, while West Texas Intermediate (WTI) declined to $57.22.
📊 Key Data Releases 📊
📅 Wednesday, April 9:
📦 Wholesale Inventories (10:00 AM ET):
Forecast: 0.3%
Previous: 0.8%
Indicates the change in the total value of goods held in inventory by wholesalers, reflecting supply chain dynamics.
🗣️ Richmond Fed President Tom Barkin Speaks (11:00 AM ET):
Remarks may shed light on economic conditions and policy perspectives.
📝 FOMC Meeting Minutes Release (2:00 PM ET):
Provides detailed insights into the Federal Reserve's monetary policy deliberations from the March meeting.
⚠️ Disclaimer: This information is for educational and informational purposes only and should not be construed as financial advice. Always consult a licensed financial advisor before making investment decisions.
📌 #trading #stockmarket #economy #news #trendtao #charting #technicalanalysis
Warning Relief Rally Maybe DelayedLooking how closed tonight on that support
does not bond well for me
So if we break that low I am out long and will short SPY
Add IWM MAGS short they make new lows
Add TZA new high. Guys it breaks we will just drop few days 450 lower
We hold that good also banks Friday earnings can be a NASTY day tomorrow rest week

SPY | Things Could Get Ugly | ShortSPDR S&P 500 ETF Trust seeks to provide investment results that, before expenses, correspond generally to the price and yield performance of the S&P 500 Index. The Trust seeks to achieve its investment objective by holding a portfolio of the common stocks that are included in the index (the "Portfolio"), with the weight of each stock in the Portfolio substantially corresponding to the weight of such stock in the index.
SPY Technical Breakdown & Macro Context1. Big-Picture Narrative
There’s increasing talk of a “104% China Tariff,” bringing back memories of Donald J. Trump’s 1988 loss in a piano auction to a Japanese buyer—an event some speculate influenced his later calls for high import taxes. Fast-forward to today, and concerns about renewed tariff escalation add extra pressure on the markets. The user’s view: unless there’s a political shift—where Republicans become more concerned about broader voter sentiment than aligning with Trump—this could drive the S&P 500 down to 3000. While that is quite a distance from current levels, it underscores how aggressive policy moves (tariffs, trade wars) can weigh heavily on equities.
2. Hourly & Daily Chart Overview
Short-Term (Hourly)
Price has trended steadily downward, with each bounce finding new sellers at lower highs.
Key Levels on the chart include:
510.84 (L. Vol ST 1a) – A noteworthy pivot-turned-resistance.
498.01 (L. Vol ST 2a) – Important resistance-turned-support level that recently broke.
485.18 (H. Vol Sell Target 1a) – Currently acting as near-term support.
472.35 (Weeks High Short) – Further support below 485.
Longer-Term (Daily)
The broader trend remains bearish, with high-volume selling in the last few sessions.
RSI on the daily is dipping into the 30s, indicating oversold conditions—but remember that oversold can persist in a strong downtrend.
Elevated ATR (14) around 16 suggests volatility remains high; large intraday swings can occur.
3. Possible Trade Setups
A) Bearish Continuation (Primary)
Entry Trigger:
A failure to reclaim 498 (L. Vol ST 2a) or a decisive break below 485.18 on strong volume.
Profit Targets:
First Target: 472.35 (Weeks High Short)
Second Target: 459.52 (Half 1 Short) for a larger downside move
Extreme Target: If policy missteps intensify and no political moderation occurs, the user foresees a slide to S&P 3000—an extreme scenario but a reminder of how macro risks can extend a downtrend.
Stop Loss:
Just above 500–502 if you’re entering on a breakdown, to protect against whipsaw should SPY manage a strong recovery above key resistance.
B) Oversold Bounce (Alternative)
Entry Trigger:
A strong reclaim of 498–500 and at least one hourly close above it, indicating buyers have stepped in.
Profit Targets:
First Target: 510.84 (L. Vol ST 1a)
Second Target: 523.67 (Best Price Short level) if bullish momentum accelerates
Stop Loss:
Below 485 to limit risk in case the rally fails and downtrend resumes.
4. Macro & Political Watch
Tariffs & Trade Policy: New or increased tariffs can rapidly shift market sentiment. Keep an eye on headlines for abrupt policy changes or legislative updates.
Political Dynamics: If Republicans shift their stance or emphasize broader voter concerns over aligning with Trump’s trade approach, it might calm markets. Conversely, unwavering support for tariff policies could amplify market downside.
Economic Indicators: In addition to politics, watch earnings releases and consumer data. If the economy shows unexpected weakness amid tariff concerns, selling pressure could intensify.
5. Final Thoughts
Volatility is Elevated: Intraday whipsaws are common; stay disciplined with stop-loss placements.
Bearish Bias Persists: The trend is clearly down unless bulls can reclaim key resistance levels with conviction.
Manage Risk: Always size positions appropriately given the current volatility, and remain prepared for sudden news-driven moves.
In summary, tariffs and politics remain a focal point, with historical anecdotes highlighting how personal experiences can shape trade policy. Whether SPY crashes all the way to 300 (S&P 3000) depends on how severe and prolonged these headwinds become. Keep a close eye on technical levels, watch for policy announcements, and maintain a vigilant approach to risk management.

SPY: TA-Market Chaos Calls for Smart Eyes, Not Just Smart ChartsThe market isn't playing fair lately. Classic TA setups are getting invalidated. Support zones crumble in seconds. Even golden cross setups fizzle out.
But this isn’t the time to quit—it’s the time to get tactical.
When technicals break, the silent signals from the options market become louder. That’s where Gamma Exposure (GEX) step in. This week, we saw aggressive institutional repositioning, unexpected volatility, and coordinated rotations into both risk and safety assets.
Let’s talk about SPY, our macro compass. Then we’ll dive into stock-specific GEX sentiment and options setups that still offer alpha.
🔎 SPY – Institutional Tug-of-War
Trend: SPY is forming a falling wedge, which could break either way. Price is sitting just above $500, after tagging the Highest Negative GEX / PUT Wall around $505–$502, which held on Friday.
GEX & Options Flow:
* PUTs at 84.7% dominate the board.
* IVR is 121.8, showing high implied volatility demand.
* Strong support from PUT walls at $502, while CALL resistance at $547–$551 could suppress any upside.
Outlook:
* If $502 breaks, momentum could drag us toward $490 or even $475.
* Bulls need to reclaim $520, flipping the key Gamma Wall.
Strategy Suggestion:
For options, consider SPY put spreads if below $505, or long SPY calls above $520 for quick squeezes—preferably with tight expiry (0DTE or 2DTE) to ride the gamma wave.

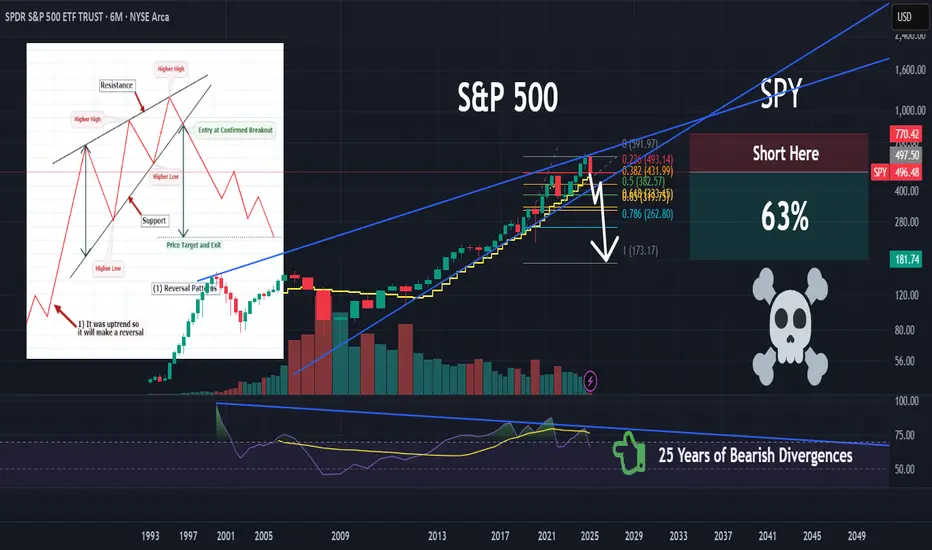
$SPY the final leg down? Bottom between $400 - $441It's looking like we're going to break the low I originally had at $481 from the top at $612.
The next most likely target is $441, and if we break that $414.
Both of those levels are good long term buys, the move should happen this week (and likely tomorrow) and that should mark the bottom for the market.

SPY/QQQ Plan Your Trade Update For 4-8 : Absolute PerfectionThank you. Thank you to all of you who follow my videos and believe in my research.
The last few days/weeks have been absolutely incredible.
My SPY Cycle Patterns, on average, are about 70-80% accurate over a 12-month span of time. There are things, like news and big events (elections, outside forces, big news) that can disrupt any market trend and completely invalidate my SPY Cycle Patterns.
But, when the markets are generally left to their own accord, the SPY Cycle Patterns play out almost perfectly.
Yes, traders need to learn to adopt a PLAN A vs. PLAN B mentality with my SPY Cycle Patterns.
If Brad is right - this will happen. And if Brad is wrong, the opposite will likely happen.
But, the comments I've been receiving over the past 20+ days have been incredible.
Thank you.
Knowing that I'm reaching a larger group of people now (than when I started doing these videos about a year ago) and knowing that some of you are really seeing some BIG GAINS following my research is simply incredible.
I started doing these videos to prove my research and tools were incredible solutions for traders. But, at the same time, I started doing this to combat some of the scammers that are out there.
In my world, watching people (or hearing from them) after they've been scammed a couple of times is heartbreaking.
Most people put a lot of time and effort into trying to become skilled traders. I get it.
That's why I'm doing this - to show you the right path and to show you that price is the ultimate indicator.
Again, thank you from the bottom of my heart. Keep sending me those success stories and...
GET SOME.
#trading #research #investing #tradingalgos #tradingsignals #cycles #fibonacci #elliotwave #modelingsystems #stocks #bitcoin #btcusd #cryptos #spy #gold #nq #investing #trading #spytrading #spymarket #tradingmarket #stockmarket #silver

Island Bottom CONFIRMED on $SPY IF we GAP up tomorrow!Island Bottom CONFIRMED on AMEX:SPY SP:SPX IF we GAP up tomorrow!
I only believe we can GAP up tomorrow if there is news of China coming to the negotiation table with the U.S. after they raise the Reciprocal Tariffs to 104%.
If this doesn't happen, then this isn't confirmed, and we see a retest of $482, IMO!
I'm not playing this as a trade until we get confirmation! Too dangerous!
Not financial advice

SPY/QQQ Plan Your Trade Update 4-8 : Counter Trend Bottom/RallyThis video was created to help you better understand why it is important to WAIT for the SPY Cycle Patterns to setup efficiently.
It is critically important that all of you learn the three basic rules of trading.
1. Never try to force a position/trade. If your research tells you some type of price event/trend is likely - don't jump into the trade too early. Wait for confirmation and wait for price to confirm your analysis is correct.
2. Start with a small position. Never GO BIG on your initial trade. If you are wrong, you can manage the trade with a small win/loss. If price moves in the direction you expect, you can add more once you get confirmation the trend will continue (potentially).
3. BOOK PROFITS early and keep BOOKING PROFITS as the trend continues higher. You can always get back into the trade with CALL/PUT options - but if you don't learn to BOOK PROFITS EARLY (20-30% profits in the trade), then you'll very likely FAIL to build your account efficiently.
(Trust me, #3 is VERY IMPORTANT)
Beyond these three simple concepts, one of the most important aspects of trading with my SPY cycle patterns is to learn to WAIT for the pattern to setup efficiently.
Today is a great example.
The BOTTOM/Rally Start pattern was in Counter-trend mode. Thus, I expected it to be INVERTED - turning it into a TOP/Selloff Start pattern.
In order for that pattern to play out, we needed to see the markets open higher (and potential trend higher for a bit of time), then roll over into a top pattern. After that tops pattern setup, the markets should continue to move into a moderate selloff trend (downward).
Think about it. Were you smart trying to SELL INTO the rally this morning or were you smart to wait for the ROLLOVER and sell into the breakdown trend?
IMO, smart traders waited for the top to setup/confirm and started selling as we got into the breakdown trend phase.
Again, I'm trying to help you learn to become a better trader.
I hope this video helps.
Get some.
#trading #research #investing #tradingalgos #tradingsignals #cycles #fibonacci #elliotwave #modelingsystems #stocks #bitcoin #btcusd #cryptos #spy #gold #nq #investing #trading #spytrading #spymarket #tradingmarket #stockmarket #silver

$SPY POTENTIAL BOTTOMAMEX:SPY is at a pretty interesting spot here—right around the same level we saw during the last two major drops over the past 5 years. Both of those times, price either held or quickly bounced off the weekly 200 EMA, and RSI was oversold.
Could there be more downside? Sure. But if I were someone looking to start positioning near a potential bottom—or at least close to one—this is the kind of level I’d be watching and putting some funds to work.

Trade with me! Walkthrough as I short SPY on a 1 min chartThis is a long video and unfortunately we got cut off at the 1 HR mark right before the ensuing dump toward our TP level (currently 5 minutes after the video up 30% on the position).
Recommend watching on 2x, 3x, 4x speed if you want but also a lot of insights as to what I'm looking out for through my typing. I would have liked to do this with a mic but I'm in a loud environment and wanted to get this out to you.
Hope you enjoy and aren't bored (which sometimes, trading is just boring!)
Happy Trading :)

Understanding the Downside Market and who controls priceA downtrend starts with Dark Pool Buy Side Institutions slow rotation to lower inventory of a stock or ETF. The rotation bends the trend into a rounding pattern that is visible on the stock or ETF chart. The goal of the Dark Pool rotation is not to disturb the uptrend while they are slowly selling shares of stock over several months time. The bending of the price is a signal that the Dark Pools are in rotation. If a chart has Peaks and Valleys trendline pattern that is NOT Dark Pools. Controlled TWAP orders are automated and controlled by the events of that day.
At some point professional traders and the Sell Side Institutions will recognize the hidden rotation and start setting up sell short trades.
The upside requires more and more buyers to keep the trend moving upward. However, the downside does NOT require more and more sellers. All that is required is a void of buyers and the stock will start a downward correction on the short term or intermediate term trend.
A void of buyers also creates the opportunity for High Frequency Trading companies who are Maker/Takers to sell short. The sell short orders fill the queues of the market before it opens and then the computers of the stock exchanges gap the stock down to a first level of some buyers. HFTs, Hedge Funds and Big Money Center Banks Sell short and place their automated buy to cover order way below causing the stock price to plummet.
Then smaller funds VWAP orders trigger and the stock collapses.
What I am trying to teach is the sell side and the buy side are totally different.
They are NOT mirror images of each other.

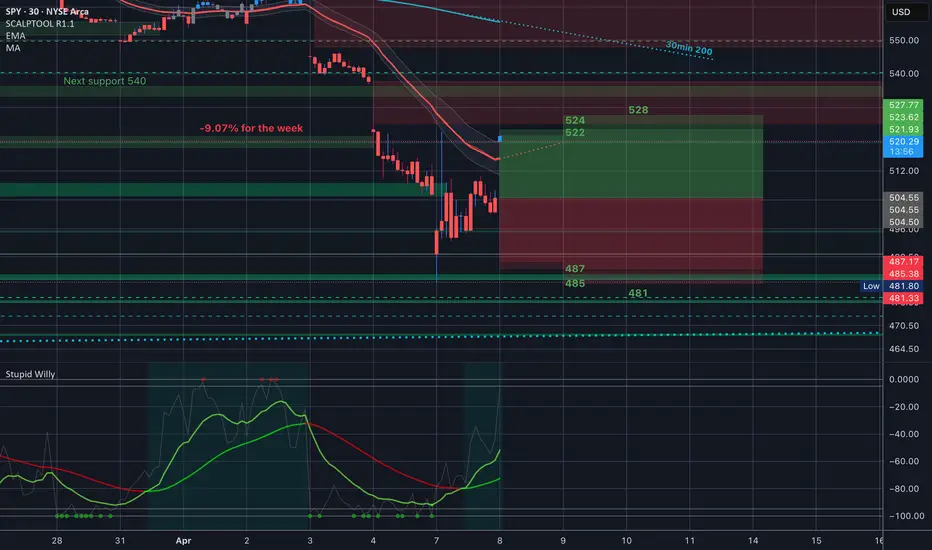
can bulls hold the line? or nahwatch this spy 489-497 support zone, if support holds into the close we could see a major bounce to the 550 level where a sold my shares 1-2 weeks ago 🎯
if we cant hold then the downside continues, theres not much short term support below here.. boost and follow for more 🔥

$SPY Trading Range for April 8 2025AMEX:SPY Trading Range for April 8 2025
35EMA is in focus - can we hold it. We opened at the top of the implied move
I'm selling bear call spreads at these levels - but in SPX today.
$SPY Review of Black Monday
Alright - Yesterday - These trading ranges came out late but with plenty of time to take some great trades.
We hit the bottom of the implied move, the top of the implied move and we saw resistance at the 35EMA. Spreads on both ends paid. 10% intraday moves
