SPY at the Edge! Will Buyers Step Up or Is More Blood Ahead?🔥 🚨
Market Structure Insight
SPY is currently in a sharp descending channel, respecting both the upper and lower trendlines. After a clean Break of Structure (BOS) at 546.97 and a failed CHoCH attempt, the price accelerated downward and is now hovering just above a key psychological round level near $500.
The most recent BOS confirms a bearish continuation, but the current price is sitting at the bottom of the channel, where a short-term bounce may occur if momentum slows down. We're in the discount zone—a key area Smart Money often targets for reversals.
Smart Money & Technical Zones
* Resistance zone: $546.97 (last BOS area)
* Support zone: $502.19 (recent swing low)
* Channel bounds: Top near $550–560, Bottom near $500
MACD is starting to curve upward while Stoch RSI is lifting from the oversold zone — potential signs of a short-term relief rally. However, there’s no CHoCH yet to confirm a structural reversal.
GEX & Options Sentiment Breakdown
* IV Rank: 121.8 → Elevated implied volatility, prime for option premium selling.
* IVx avg: 53.1 → Still rising, shows fear entering the market.
* PUTS Dominate: 84.7% of options flow are puts.
* GEX Bias: Strong negative gamma exposure, indicating dealer selling accelerates downside moves.
* Key Support Walls:
* $520: Highest negative NETGEX / Put Support.
* $500: Second Put Wall with -76.41% pressure.
* Resistance Walls:
* $547: HVL and minor call resistance.
* $560: 3rd CALL Wall, minimal resistance at 1.26%.
Dealers are heavily short gamma, suggesting large directional swings and continued volatility.
Trade Setups
Scenario 1 – Dead Cat Bounce (Bullish Relief Rally)
* Entry: Above $510 with confirmation of strong volume or CHoCH.
* Target 1: $520 (first structural test).
* Target 2: $546–$551 HVL rejection zone.
* Stop Loss: Below $502
Scenario 2 – Bearish Continuation
* Entry: Rejection at $510–$520 zone or breakdown of $502
* Target 1: $495 psychological level
* Target 2: $485–$475 (overshoot flush level)
* Stop Loss: Above $522
Investor Strategy Insight
Long-term investors should remain cautious until SPY shows structural strength above $546. Until then, dollar-cost-averaging with tight capital allocation could be safer. This environment favors option sellers due to elevated IV, or high-conviction intraday scalping on well-defined levels.
Outlook & Mindset
This week is dominated by uncertainty—rising global tariffs, geopolitical risk, and credit tightening all weigh on risk-on sentiment. SPY may enter a volatile range-bound phase between $500–$550, until new macro data shifts sentiment.
If you’re trading SPY this week, don’t try to catch the knife. Wait for confirmation candles or volume shifts, and be nimble with risk.
Disclaimer
This analysis is for educational purposes only and does not constitute financial advice. Always do your own research and manage risk responsibly.
S27 trade ideas

SPY dump at openim expecting SPY to drop to $480.30 in the first little bit of the morning session. from there bulls will have a chance to send us up higher. i will be playing with an open mind and letting bulls have at the bounce

$SPY Last WeekAMEX:SPY We broke many supports and are looking for Support
Stay Tuned - Today's Trading Range is coming out.
Don't rush into a trader just to trade - But also, if you see a great opportunity take it.

Nothing newSPY will touch the tendency line, if you see, was a needed pullback. We should have a new run by the end of april.
Previews pullbacks: 25% and 33% the covid one. As reference.

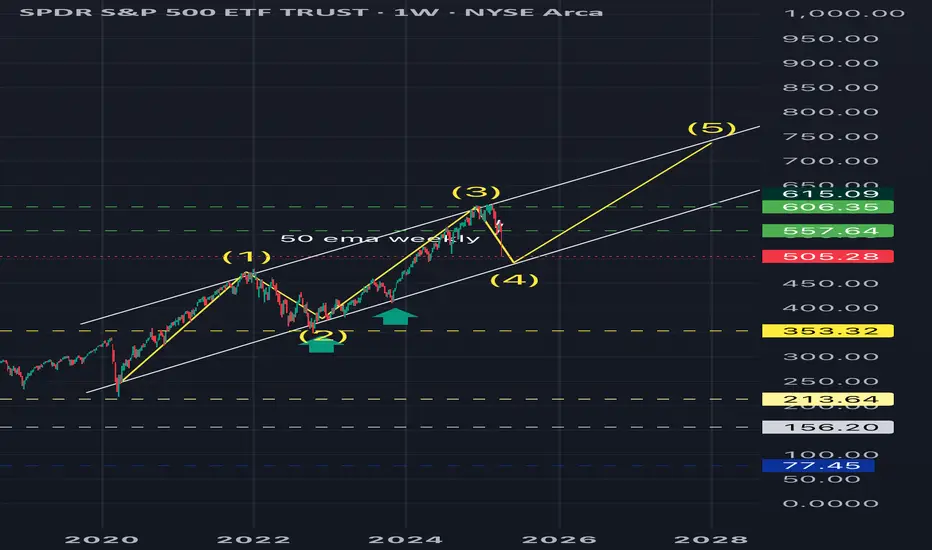
Wave 5We have completed the abc between wave 3-4
Wave 5 is usually equal to wave 2 in length and time so I see we get another 2 year bull run from here.
Spy 750 from here
Spy Bear Market Territory Spy need's To Hold $482 Or Its even lower as go as low as $474ish..... I would like to see us hold $482 to possibly take the long to $495, Theoretically speaking if we actually open up Monday in this range that's exactly what i would be looking for call etc..... But because the market is so volatile i most likely wait a whole hour to decide when and where to take my position, But other than that if we hold $482ish i would long short term day trades ext if lower than $482 I'm short.... AS always good luck and safe trades traders

SPY Long for the lower highWatching a potential Head & Shoulders forming here near the uptrend line going back to the covid crash lows. Thinking we get a bounce here in this 489-500 area for a move back to 550 for the right shoulder.

Weekly $SPY / $SPX Scenarios for April 7–11, 2025🔮 🔮
🌍 Market-Moving News 🌍:
🇺🇸📈 New U.S. Tariffs Begin April 9: Trump’s “Liberation Day” tariffs — 10% on all imports, 25%+ on key sectors — could stir volatility.
🇨🇳📦 China Retaliates April 10: A 34% retaliatory tariff on U.S. goods raises trade war fears and inflation concerns.
🏦💰 Big Bank Earnings Kick Off: JPMorgan, Wells Fargo, and BlackRock will report. Markets will watch closely for financial health signals.
📉📊 March CPI Report Coming April 10: Inflation data could sway the Fed’s rate path. Forecasts call for a 0.1% increase.
⚠️ Volatility Alert: Piper Sandler projects a possible 5.6% move in the S&P 500 this week — up or down.
📊 Key Data Releases 📊
📅 Monday, April 7:
🗣️ Fed Gov. Kugler Speaks (10:30 AM ET)
💳 Consumer Credit (3:00 PM ET) — Forecast: $15.5B | Prev: $18.1B
📅 Tuesday, April 8:
📈 NFIB Small Biz Optimism (6:00 AM ET) — Forecast: 100.7
🗣️ Fed’s Mary Daly Speaks (8:00 AM ET)
📅 Wednesday, April 9:
📦 Wholesale Inventories (10:00 AM ET) — Forecast: 0.4% | Prev: 0.8%
🗣️ Fed’s Barkin Speaks (11:00 AM ET)
📝 FOMC Minutes (2:00 PM ET)
📅 Thursday, April 10:
📉 Jobless Claims (8:30 AM ET) — Forecast: 219K
📊 CPI (8:30 AM ET) — Forecast: 0.1% | Prev: 0.2%
🗣️ Fed Gov. Bowman Testifies (10:00 AM ET)
📅 Friday, April 11:
🏭 PPI (8:30 AM ET) — Forecast: 0.2% | Prev: 0.0%
🗣️ Fed’s Musalem Speaks (10:00 AM ET)
⚠️ Disclaimer: This information is for educational and informational purposes only and should not be construed as financial advice. Always consult a licensed financial advisor before making investment decisions.
📌 #trading #stockmarket #economy #news #trendtao #charting #technicalanalysis

my extremely accurate guess! jk there is always a chance of so..SPY long term bottom
to recession levels- 360s-400 market bottom prediction
MUERTE

THE STOCK MARKET IS CRASHING!! IS THERE HOPE? (April 6, 2025)Lowkey I popped off in this video, but we looked at AMEX:SPY weekly and talk about past repeating patterns, and when this chaos could end

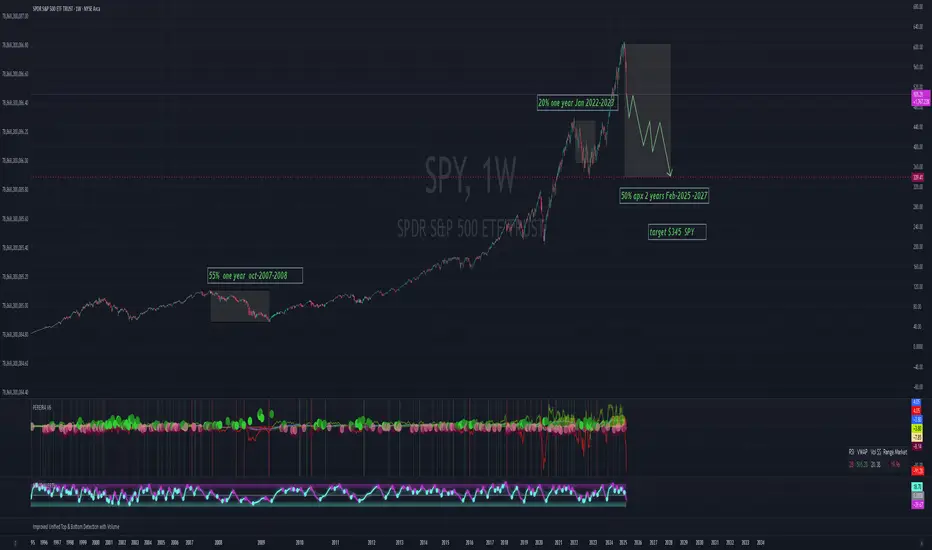
SPY w/ 2022 Fibonacci levels. The chart is the SPY with FIB levels from the 2022 bottom or close to give you an idea of where we might find support levels.

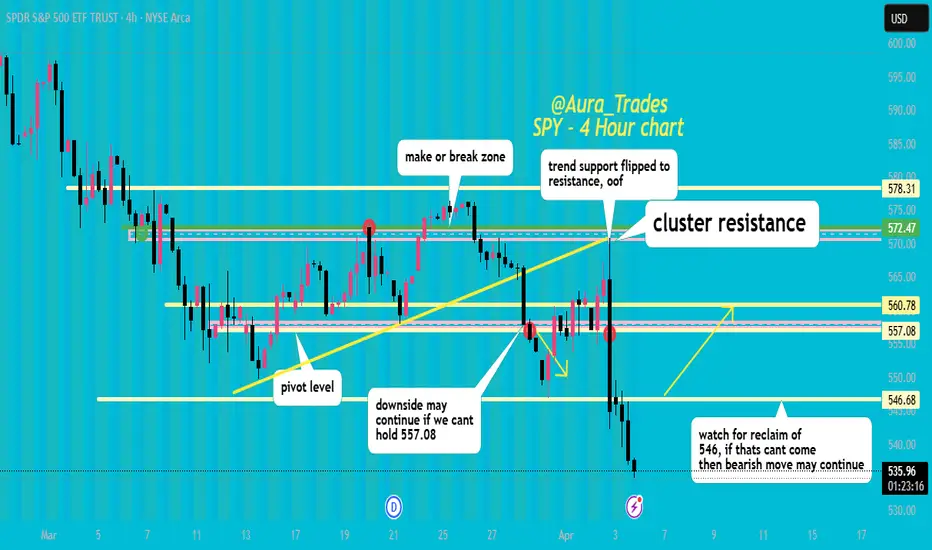
SPY with the cluster resistance rection! boost and follow for more 🔥 spy continues to break below the 557 level pivot level, I sold all my shares on the first break below last friday and have not added any back this week.
that reclaim of 557 pivot level this week only led to a cluster resistance rejection which was another bearish sign, I dont like longs right now unless we reclaim 446. for now bearish action can continue.
we will see I will keep monitoring SPY as always! GLTA

SPYAs investors, we must understand that in order for consumers to access cheaper products, sacrifices will be required in several key areas. Adjustments in Federal Reserve monetary policy (changes in the federal funds rate and balance sheet reduction) will directly impact GDP and real income. Likewise, consumer prices will reflect the impacts of inflation (CPI) and fiscal policies. Increases in labor costs (adjustments in wages and employment costs) will also play a crucial role in these changes. Private consumption (PCE) will be pressured by these dynamics, and businesses will have to decide between maintaining profit margins or passing these costs onto consumers. The key will be how these adjustments in prices and wages are negotiated, as the market seeks a new equilibrium between supply and demand. Prepare yourself, as these adjustments are part of a long and challenging process, but they are inevitable.
#SPY #SP500
SPY Equal Distance Top followed by takedown.The CD runup equaled the AB runup. 3 months of distribution followed as the SPY could not breakout. The week of 2/18/20 was the scamdemic top. The week of 2/18/25 top was the 5 year anniversary. Trump in office both times. I believe this is more than a coincidence and not just some tariff bs.
There was a reason Buffet was hoarding cash.

SPY: Week of April 7Hey everyone,
Sharing the levels for next week.
I don't have much of a forecast tbh, the thing is, in bullish markets its harder to forecast the long term, easier to forecast the short term.
In bearish markets its easier to forecast the long term, harder to forecast the short term.
Each week we have been up and down, taking out all highs and lows for the past few weeks owning to the volatility, and that is what makes it difficult to really adopt any forecast when most times we are just hitting all targets with the volatility.
Here are some things for the short term:
About 78% chance spy Retraces 528
507 is the reference target
Based on the EMA 21, there is an 89% chance of seeing a bounce on SPY.
Based on the EMA 50, there is a 69% chance.
POC from last week is at 537.
Will it bounce?
Yes, I mean like I said, we take both highs and lows out each week, I don't really foresee this week to be any different, haha.
And the longer term?
So the real interesting stuff I guess is the longer term, but not that interesting.
SPY is rapidly mean reverting. Right now the mean for SPY is around 481. This is actually within the forecasted levels for next week, so that's curious.
In 2022, the mean was 350. It took exactly 10 months (from January to October) before we finally hit it (and went 2 points lower).
At this pace, we are hitting it this month. Which is a concern. Why? Well let me tell you.
There are corrections that are required to happen generally, just a general mean reversion, not necessarily fundamentally driven. That was the example of 2022.
Then, there are corrections/crashes and cycles that are fundamentally driven. An example of this, for SPY, would be 2008.
In the fundamentally driven crashes, for SPy those would be COVID, 2008 Financial Crisis, those surpassed means and let to a stark sell. COVID was pretty quick, but 2008 was really drawn out owning to the unfolding of economic events.
The reason the 2 require distinction, is because technical and analysis are useless during fundamental corrections. You could draw fibs to the cows come up in 2008 and you would be bankrupt by month 3.
However, in 2022, technicals and such worked fine because we were just doing a basic correction from getting too far from the mean.
Interestingly enough, my comparison algorithm that compares the current year to similar years, for both SPY and SPX, has indicated that 2008 is the most similar year as of right now. This is a huge change from the results it gave even just a month ago.
For fundamental sells, it doesn't stop until stuff gets resolved. As was the case in 2008 with the required bailouts, and once the dust settled from the multiple industries and businesses that went under. Then the market started a slow and painful recovery.
The situation here is more similar to 2008 than the COVID crash. The reason being the main concern with COVID was economic shut down as a result of the pandemic. However, this was quickly curbed with modification of the work routine (industries working from home where applicable), the continuation of industries functioning and the huge stimulus that the government injected into the economy.
Right now, the issue is a global trade war. In 2018, Trump only tariffed random items (mostly metals) on a few random countries. Right now, he is blanket tariffing the global economy. He doesn't even stop there and has to bring in my favourite animal, the Peunguins.
God, Trump, what did they ever do to you? Leave the penguins alone!
This is incredibly bad, its actually unprecedented. It is essentially a world war from an economic standpoint. And we are still waiting for the verdict on some bigger nations retaliatory tariff results.
The global tariff war extends beyond just increase the cost of things, it actually may lead to a decrease in the US money supply, a rise in inflation and a huge cut to GDP for the US and other countries impacted.
Trump could lift them, ease them or something. This would probably lead to some initial reaction to the market, but it seems the market doesn't even trust him anymore because when he kept playing those "just kidding" games into the beginning of the year, the market just stopped reacting to them. It is kind of funny.
So the result is, it could be much worse than most anticipate, even myself.
As of right now, my plan is to go long in the 480s, kind of on most things. Rebuild a portfolio.
But as we progress, it seems that 480 may not indeed be the end. It just depends on Trump's mood at the time I suppose.
From a purely math analysis:
481 is the mean for spy, we are following the annual bear market path which has as low as 468.
Here is where we stand now on the annual assessment:
And then in terms of mean reversion, SPX is the most interesting to take a look at:
4,791 is the mean. The last mean correction it has had was in 2022, same as spy:
In addition, SPX just signaled a top/mean reversion signal.
On the prospects of a bottom formation:
None of my stuff indicates a bottom formation. In fact, we have some top signals just newly triggering, which is nuts I know but the reality.
So that's .. good? Maybe, haha.
Anyway, those are my thoughts.
My suggestion is to continue to position defensively in anticipation of both up and downside next week.
Safe trades!
Also, for more deep diving into the fundamentals, sort of, consider reading this post from me if you haven't already:

SPY On the verge of more downfallSPY has more room to go lower the everlasting balloon has popped by trump's nonsensical shenanigans
This is why we need new order in this world

The Perfect Trade. How I've been preparing you for this S&P DUMPThis has been the basis of my 5 recent videos on SPY - walking you through what the market was doing, what algorithms were in play and important to keep an eye out for - and ultimately, how to catch this most recent dump on a rejection (and proof) of teal strong selling.
My best trade ever in terms of profit and preparation, patience, etc.
Happy Trading :)

Reversal (landscape edit)As you can see we've nearly completed the
same amount of distance as the covid crash.
With resistance provided by the ichimoku
cloud and previous price level. Full recovery by
August.

Reversal soonAs you can see we've nearly completed the same amount of distance as the covid crash. With resistance provided by the ichimoku cloud and previous price level. Full recovery by August.

Is Stock Market Bouncing Here or Continue Crashing?Stock Market Analysis | NASDAQ:QQQ & AMEX:SPY
Mag 7 Analysis | NASDAQ:TSLA NASDAQ:NVDA AAPL AMZN MSFT GOOGL META

Spy.. Where we standSoo... I will go in detail for you so you can see where my POV comes from..
A summary of this post is a bounce. Back to 525-530 and then a possible new low to 470..
Let's start on the monthly time frame..
I will show you the chart regular then I will show you log scale (Logarithmic).
AMEX:SPY regular
Price is nearing a 5yr trend support
That support is at 495-500. There's a gap at 495 to close from April 19th 2024.. I would say if we were to gap down Monday below 500.00 that's where they will take this before buying it back up to 510.
Now do I think the correction Is over here at this trendline support? I'm leaning at it's a 70% chance we will break this support before End of May.
Why? Because of the sectors.. XLC and XLF is promising more pain to come.. imagine Spy as a car, the sectors are the important parts to keep things in motion . I'll get to the sectors later but let's stick with spy..
Now here's a monthly chart again but this time Log scale
As you can see with exception of the Covid crash spy has pretty much channel traded this the last 14yr bull run
Let's zoom in
As you can see, the bottom of this channel is around 2021 high 477. So I think Spy is headed there before End of May , it could happen sooner but you have to factor in A rally and i don't know how long that can last.
Also NASDAQ:QQQ monthly chart log scale is showing similar outlook
Zoomed in NASDAQ:QQQ
Lastly TVC:NYA
Monthly log scale
Same as Qqq and spy, headed back to 2021 high
NYA no log scale
So I've showed you the indexes now I will show you AMEX:XLF (Financials) and AMEX:XLC (Meta, NFLX)
Here's XLF price is headed back to trendline support 38-39.00 by end of May; that's another 10% drop which supports my theory that spy will tag 470
Zoomed in
XLF
Monthly 50sma aligns with trendline support so that's your target. I think any bounce on banks going into earnings should be faded!
XLC
I can't hammer on the table hard enough about how much pain is coming for this sector and it's tech stocks.. compared to the other sectors this hasn't even got started with the selling when looking at its monthly RSI and MFI. Friday price stopped right at its previous ATH
we are headed back to 82.00 which is another 8% drop on this sector, if 82 doesn't hold them , 60 comes next.. If you OWN meta on NFLX I hope you have a 5yr outlook because there will be pain
..
Now let's get into the bounce, I think a nice bounce comes next week as long as spy opens Monday above 495.00
When it comes to being oversold one of the most reliable tools I like to use is the PRICE RANGE tool with 20sma.
When you look at spy, you'll notice that in a normal market it usually moves between 2½-3½% from it's 20sma.
As of Friday's close we are 10% away from it's 20sma
This type of extension is extreme
Below I will post the last time spy was over 8% extended from it's 20sma and you can see what happened the next few sessions
June 17th 2022
Jan 24th 2022
June 8th 2020
March 2020 Covid crash
Dec 2024 2018
So in the last 7yrs spy has on dropped more that 8% from it's 20sma 5 times and with the exception of the Covid crash 10% extension was the area where you saw price Rallied back within days to retest the 20sma.
So that places us bouncing this week. Now the 20sma is fluid so even though the 20 is at 559 right now depending on how long spy takes to get there the 20ma could gravitate lower
I think 536 gap close minimum comes before we break below 495.
I will update this more tomorrow.. this right up took awhile

the week aheadprobably a good bounce monday - both IWM and DJT are hinting that buyers are coming in. We could have a fakeout either up or down first on Monday morning and test 5k.
